Pela BRQ iniciei esse projeto em janeiro/20, tendo como cliente o setor de altíssima renda (Private) de um grande banco brasileiro. Fui chamado como o único designer para fazer um projeto que inicialmente parecia pequeno. Acabou se desdobrando em 3 grandes partes/frentes que se estenderam por mais de um ano.
As necessidades das três partes do projeto:
Para que este case tenha um tempo de leitura inferior a uns 7 minutos, irei ser breve, especialmente nas partes 2 e 3.
Exemplo de esboço/wireframe dos primeiros dias para os dashboards, que eram levados impressos para a reunião.
A primeira parte (controle de tarefas, atas e dashboards) começou com uma semana que alternava, no dia, uma ou duas horas de conversas com um gerente e um especialista e o restante do tempo gerando wireframes (usando Figma). A cada reunião era apresentada uma evolução nos wireframes e era discutido em cima do que foi criado, com todos riscando em cima dos wireframes impressos.
No começo da segunda semana tínhamos um protótipo em baixa fidelidade que passou por um teste rápido de usabilidade dos dashboards com entrevista. Entre as tarefas tínhamos buscar um cliente e tirar a renda variável dos cálculos de sua rentabilidade. Já a entrevista verificava a percepção geral dos cards do dashboard e suas informações. Os usuários eram especialistas de investimentos. Entre as melhorias estavam incluir um card com vencimentos e diferenciar melhor indicadores das classes de ativos.
Estudo de cores (em alta fidelidade) para a home, após 2 semanas.
O primeiro mês seguiu mais ou menos com essa dinâmica, desenvolvendo e acertando o layout, com foco na parte dos dashboards. O segundo mês focou nos fluxos de atividades e atas, além da criação da tela de login.
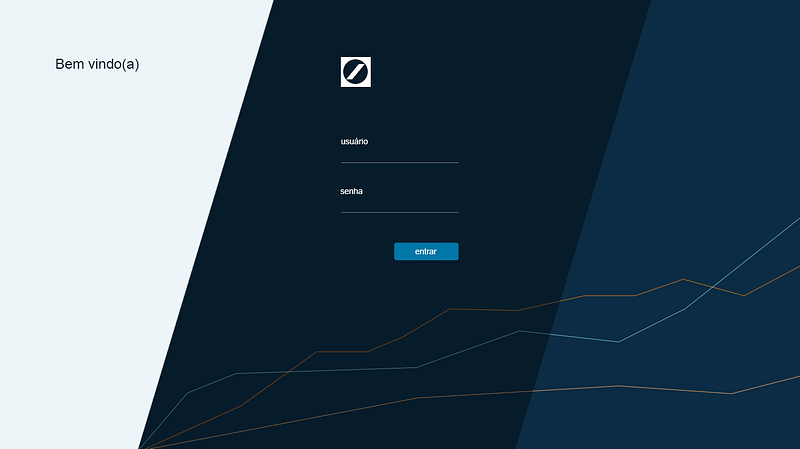
Proposta para tela de login
A segunda parte seguiu de forma mais ou menos parecida, porém era ainda mais complexa devido a quantidade de customizações e opções. A parte 3 começou com um esboço pequeno que aumentou muito em funções, se tornando um editor online de relatórios.
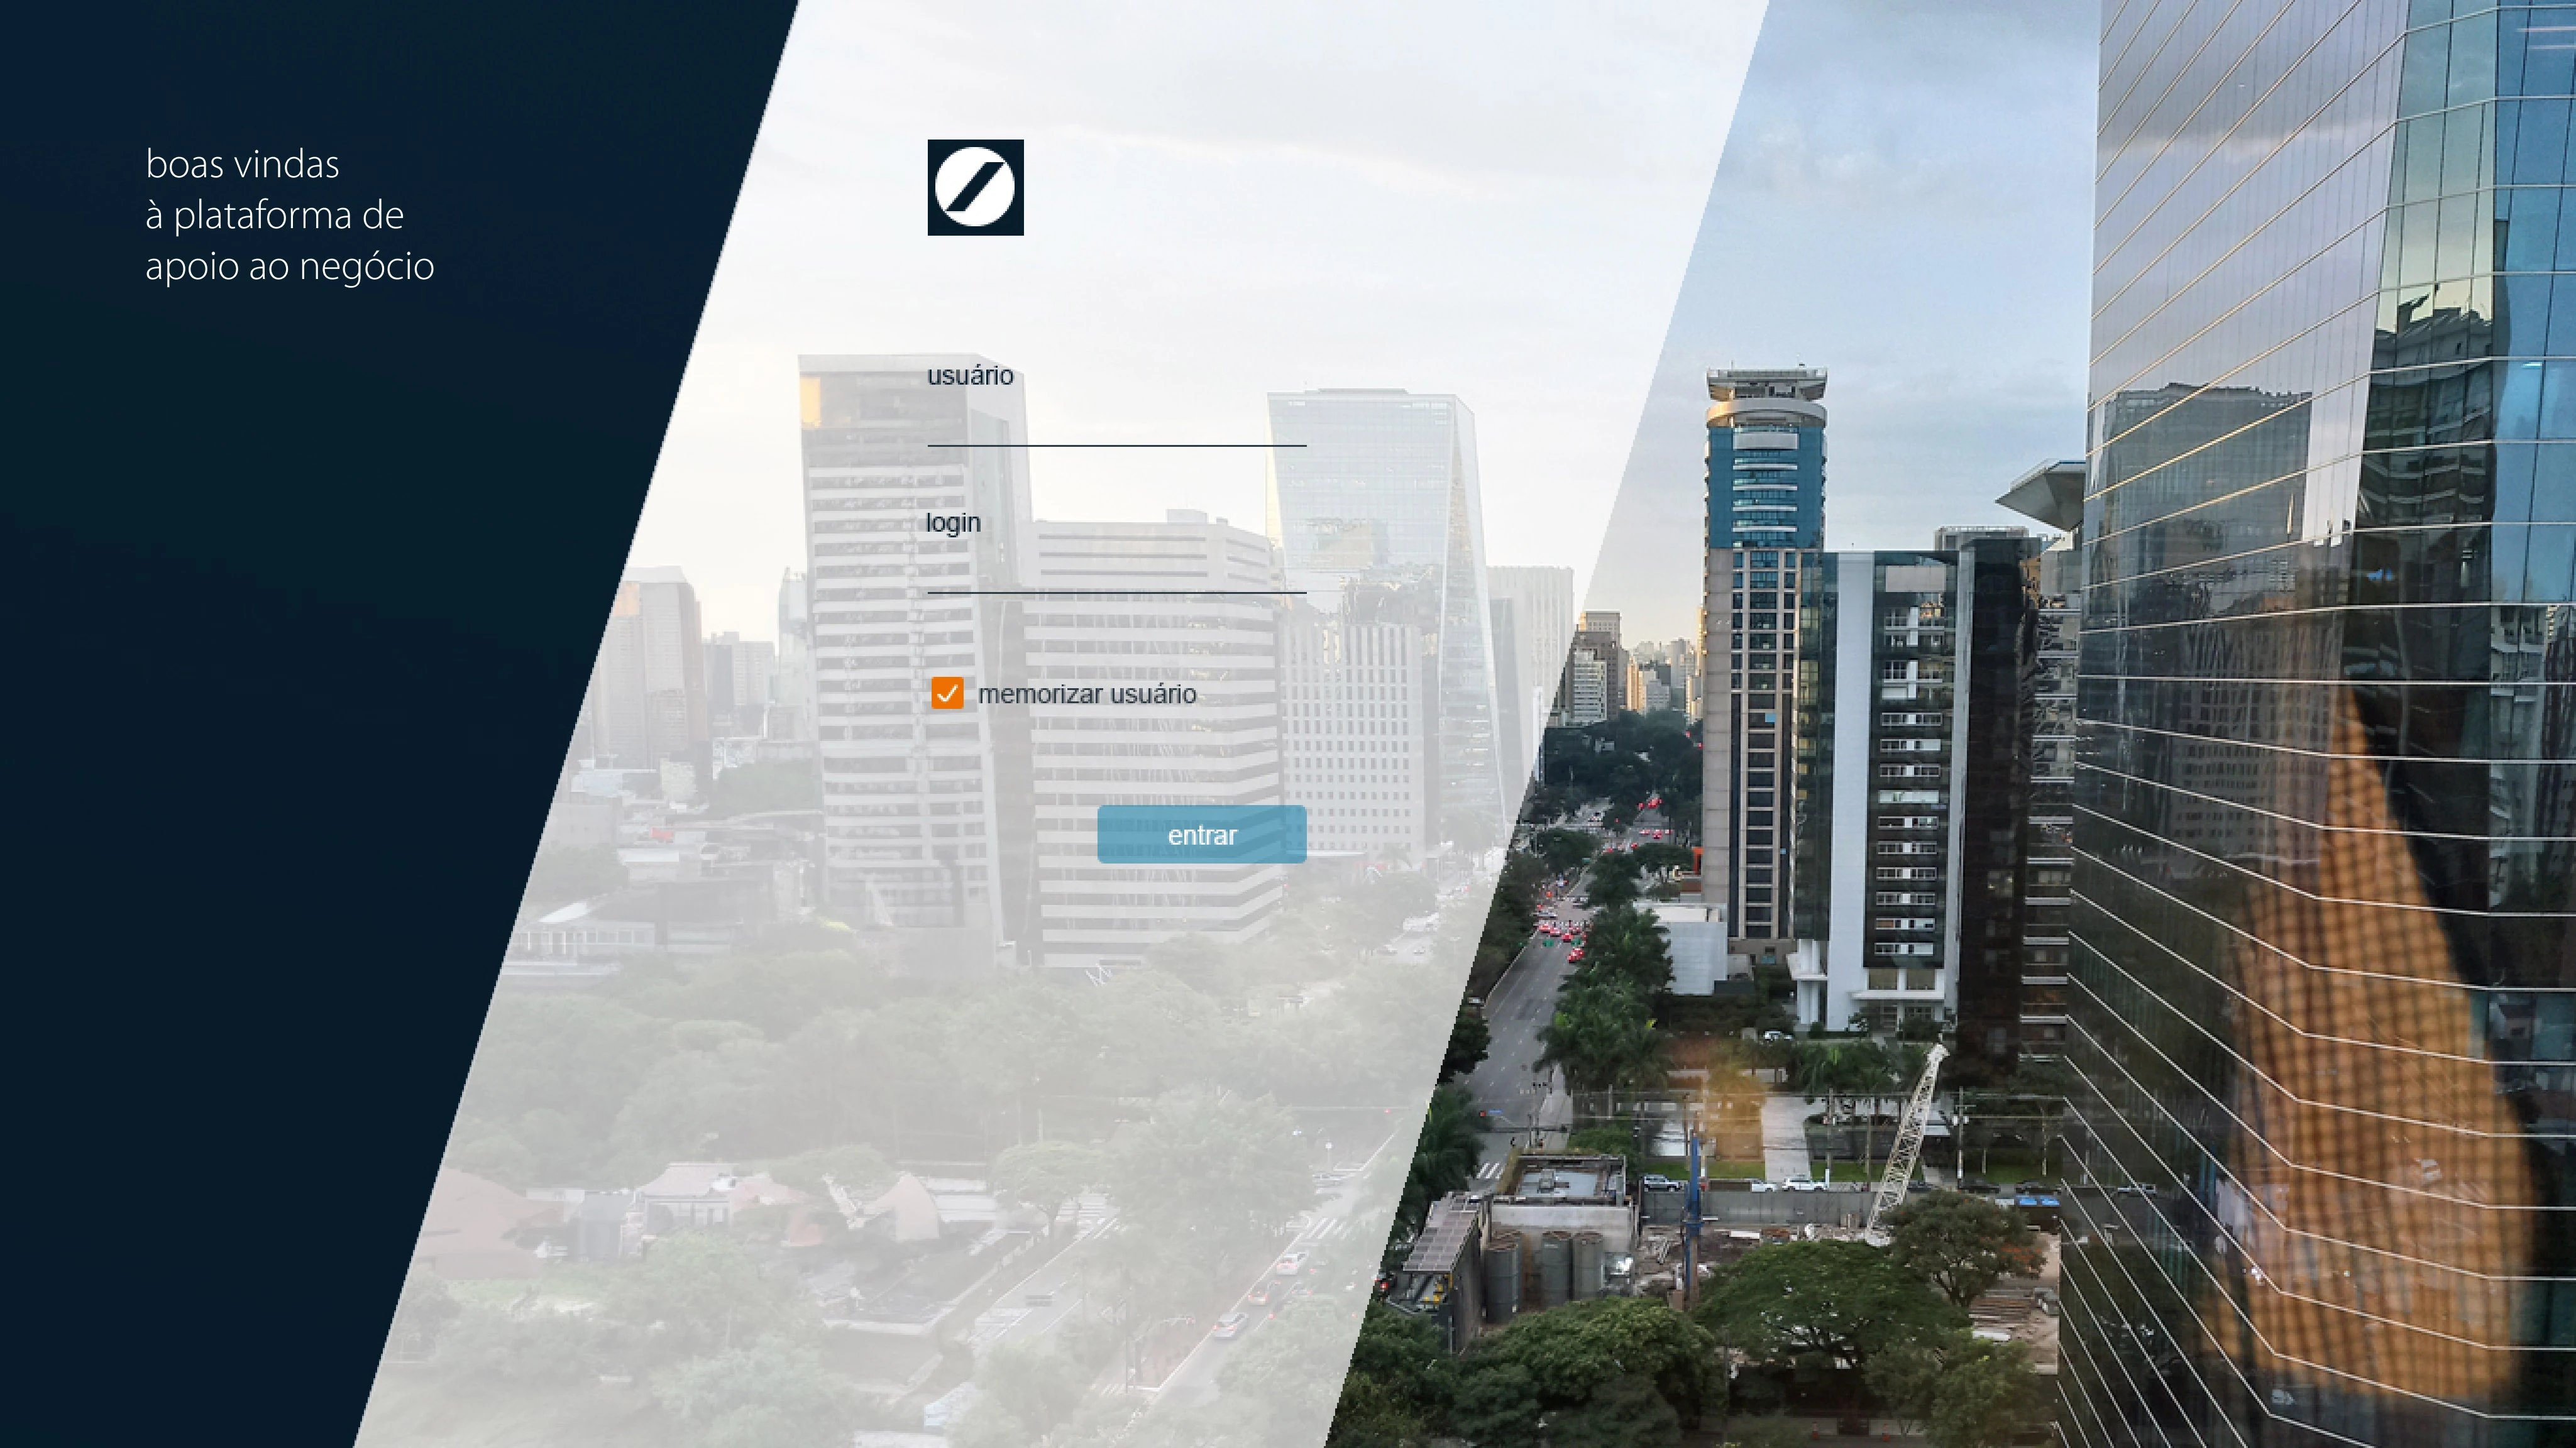
Versão final do login
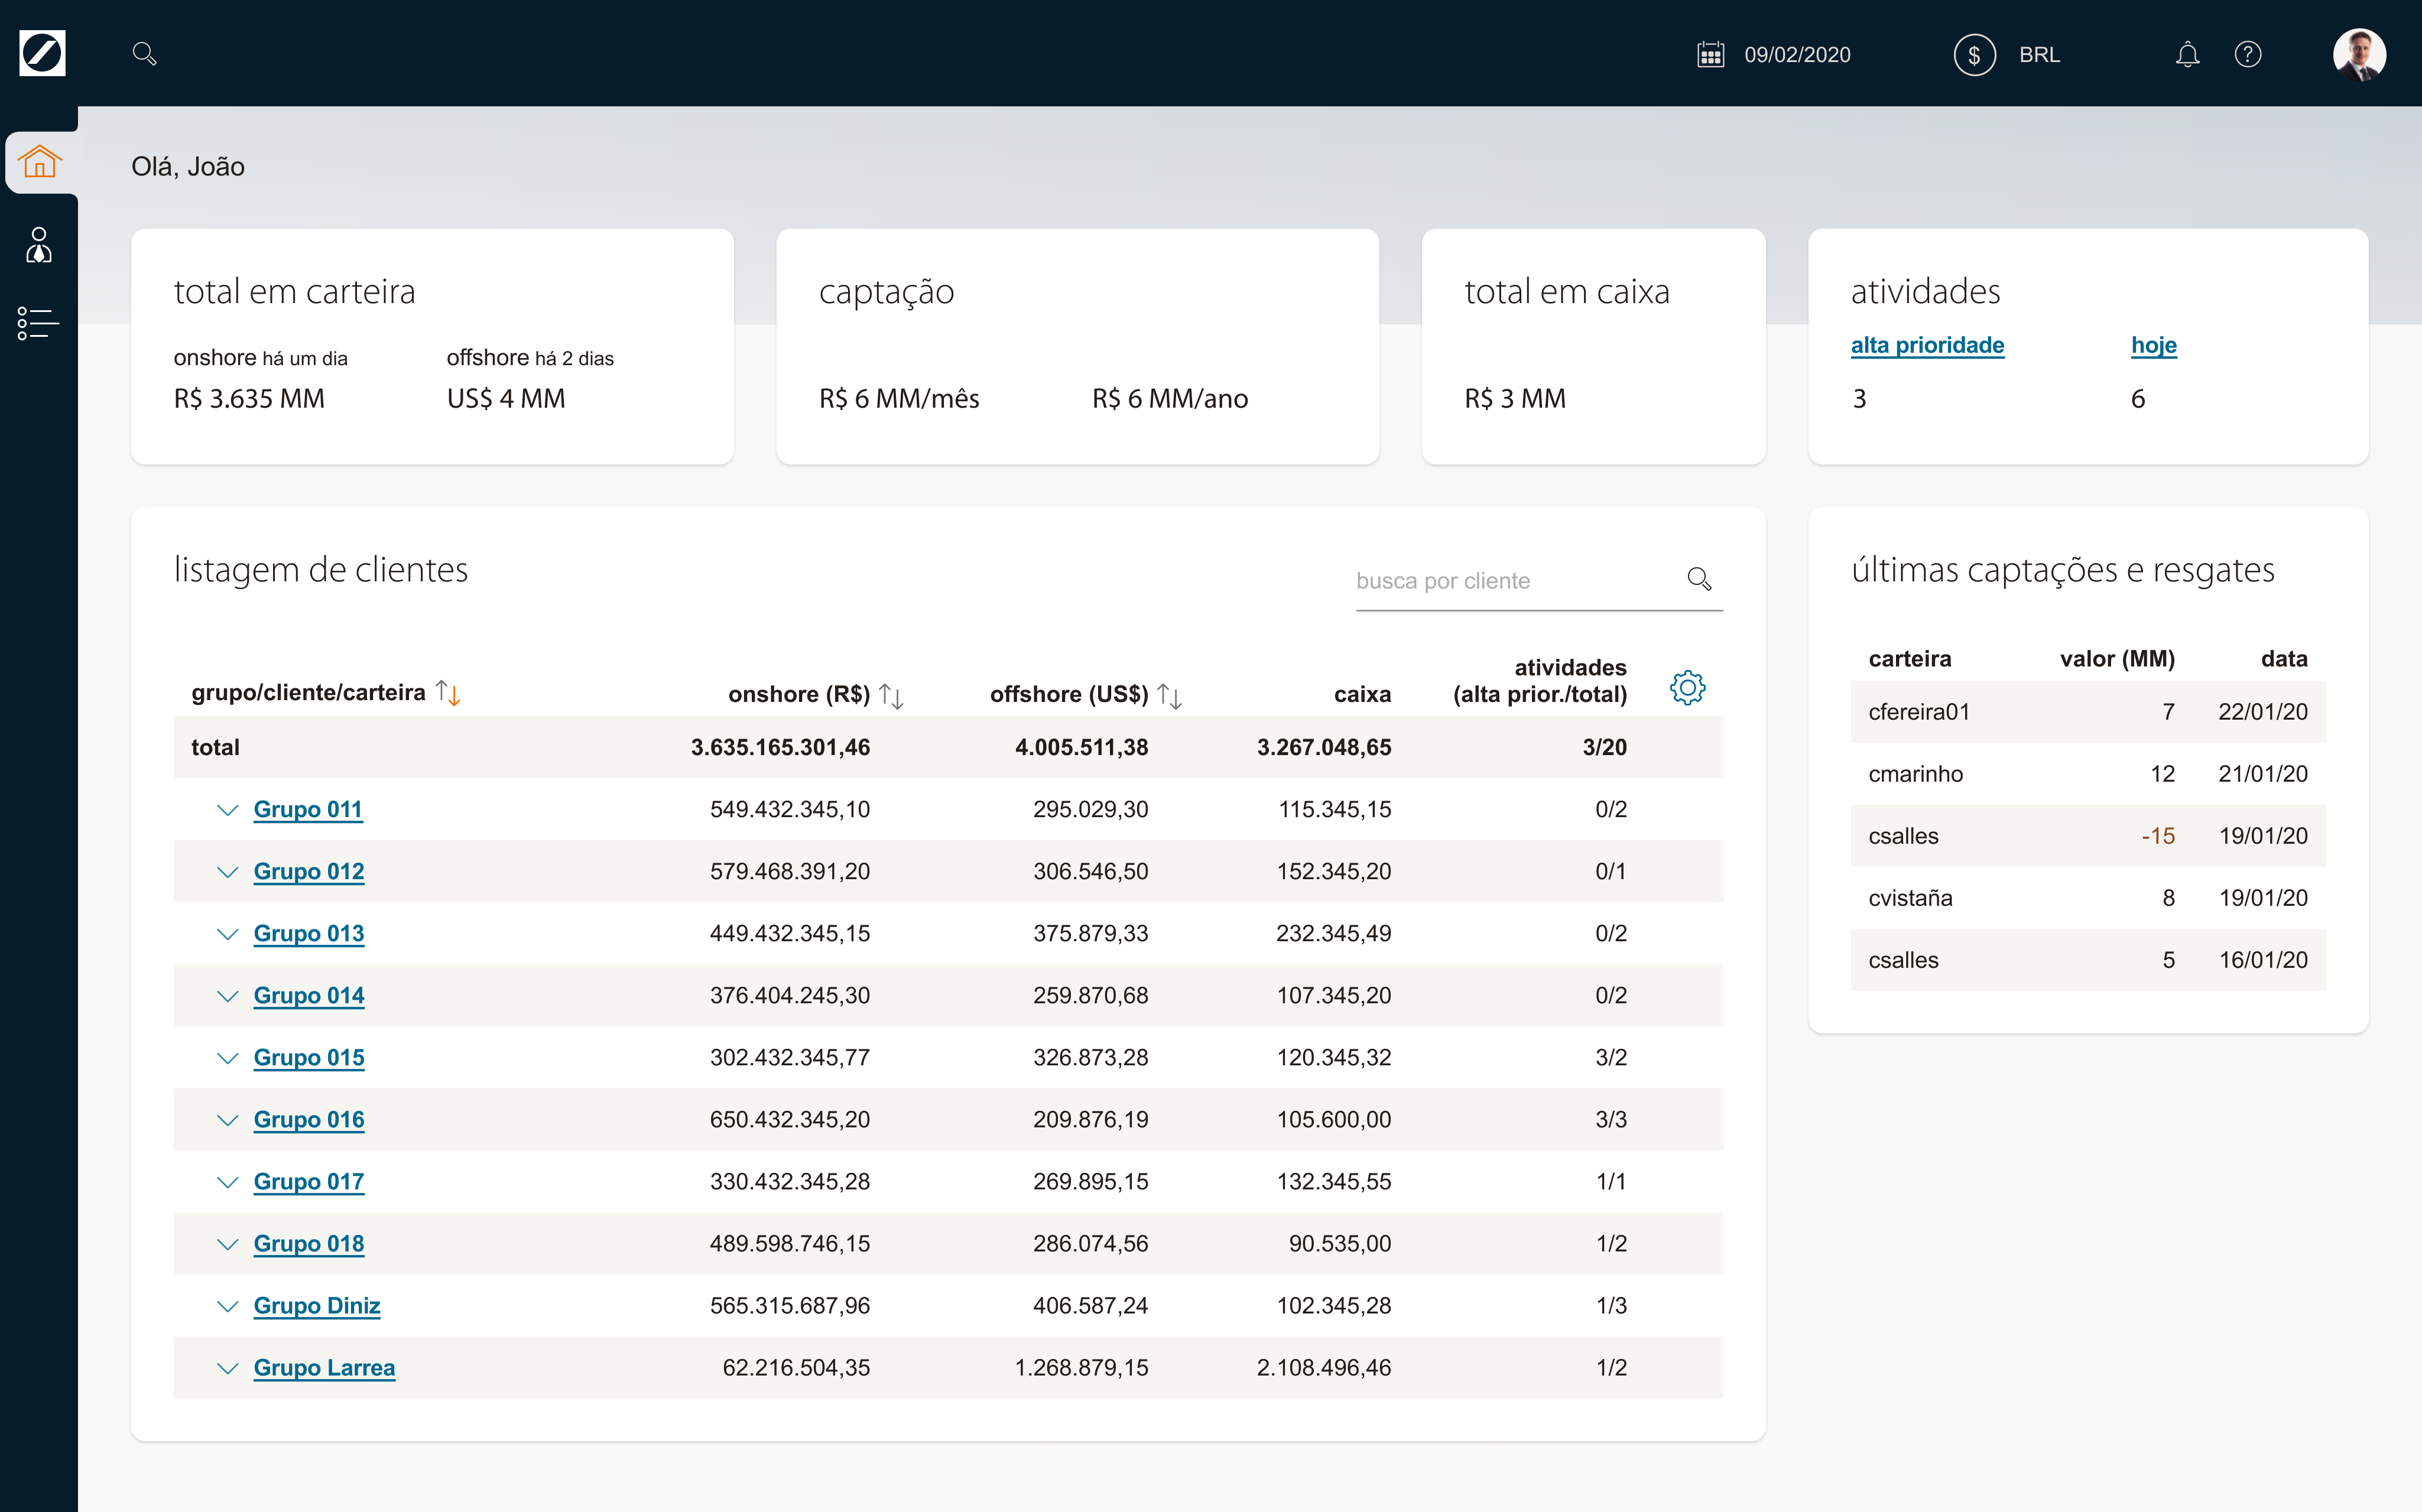
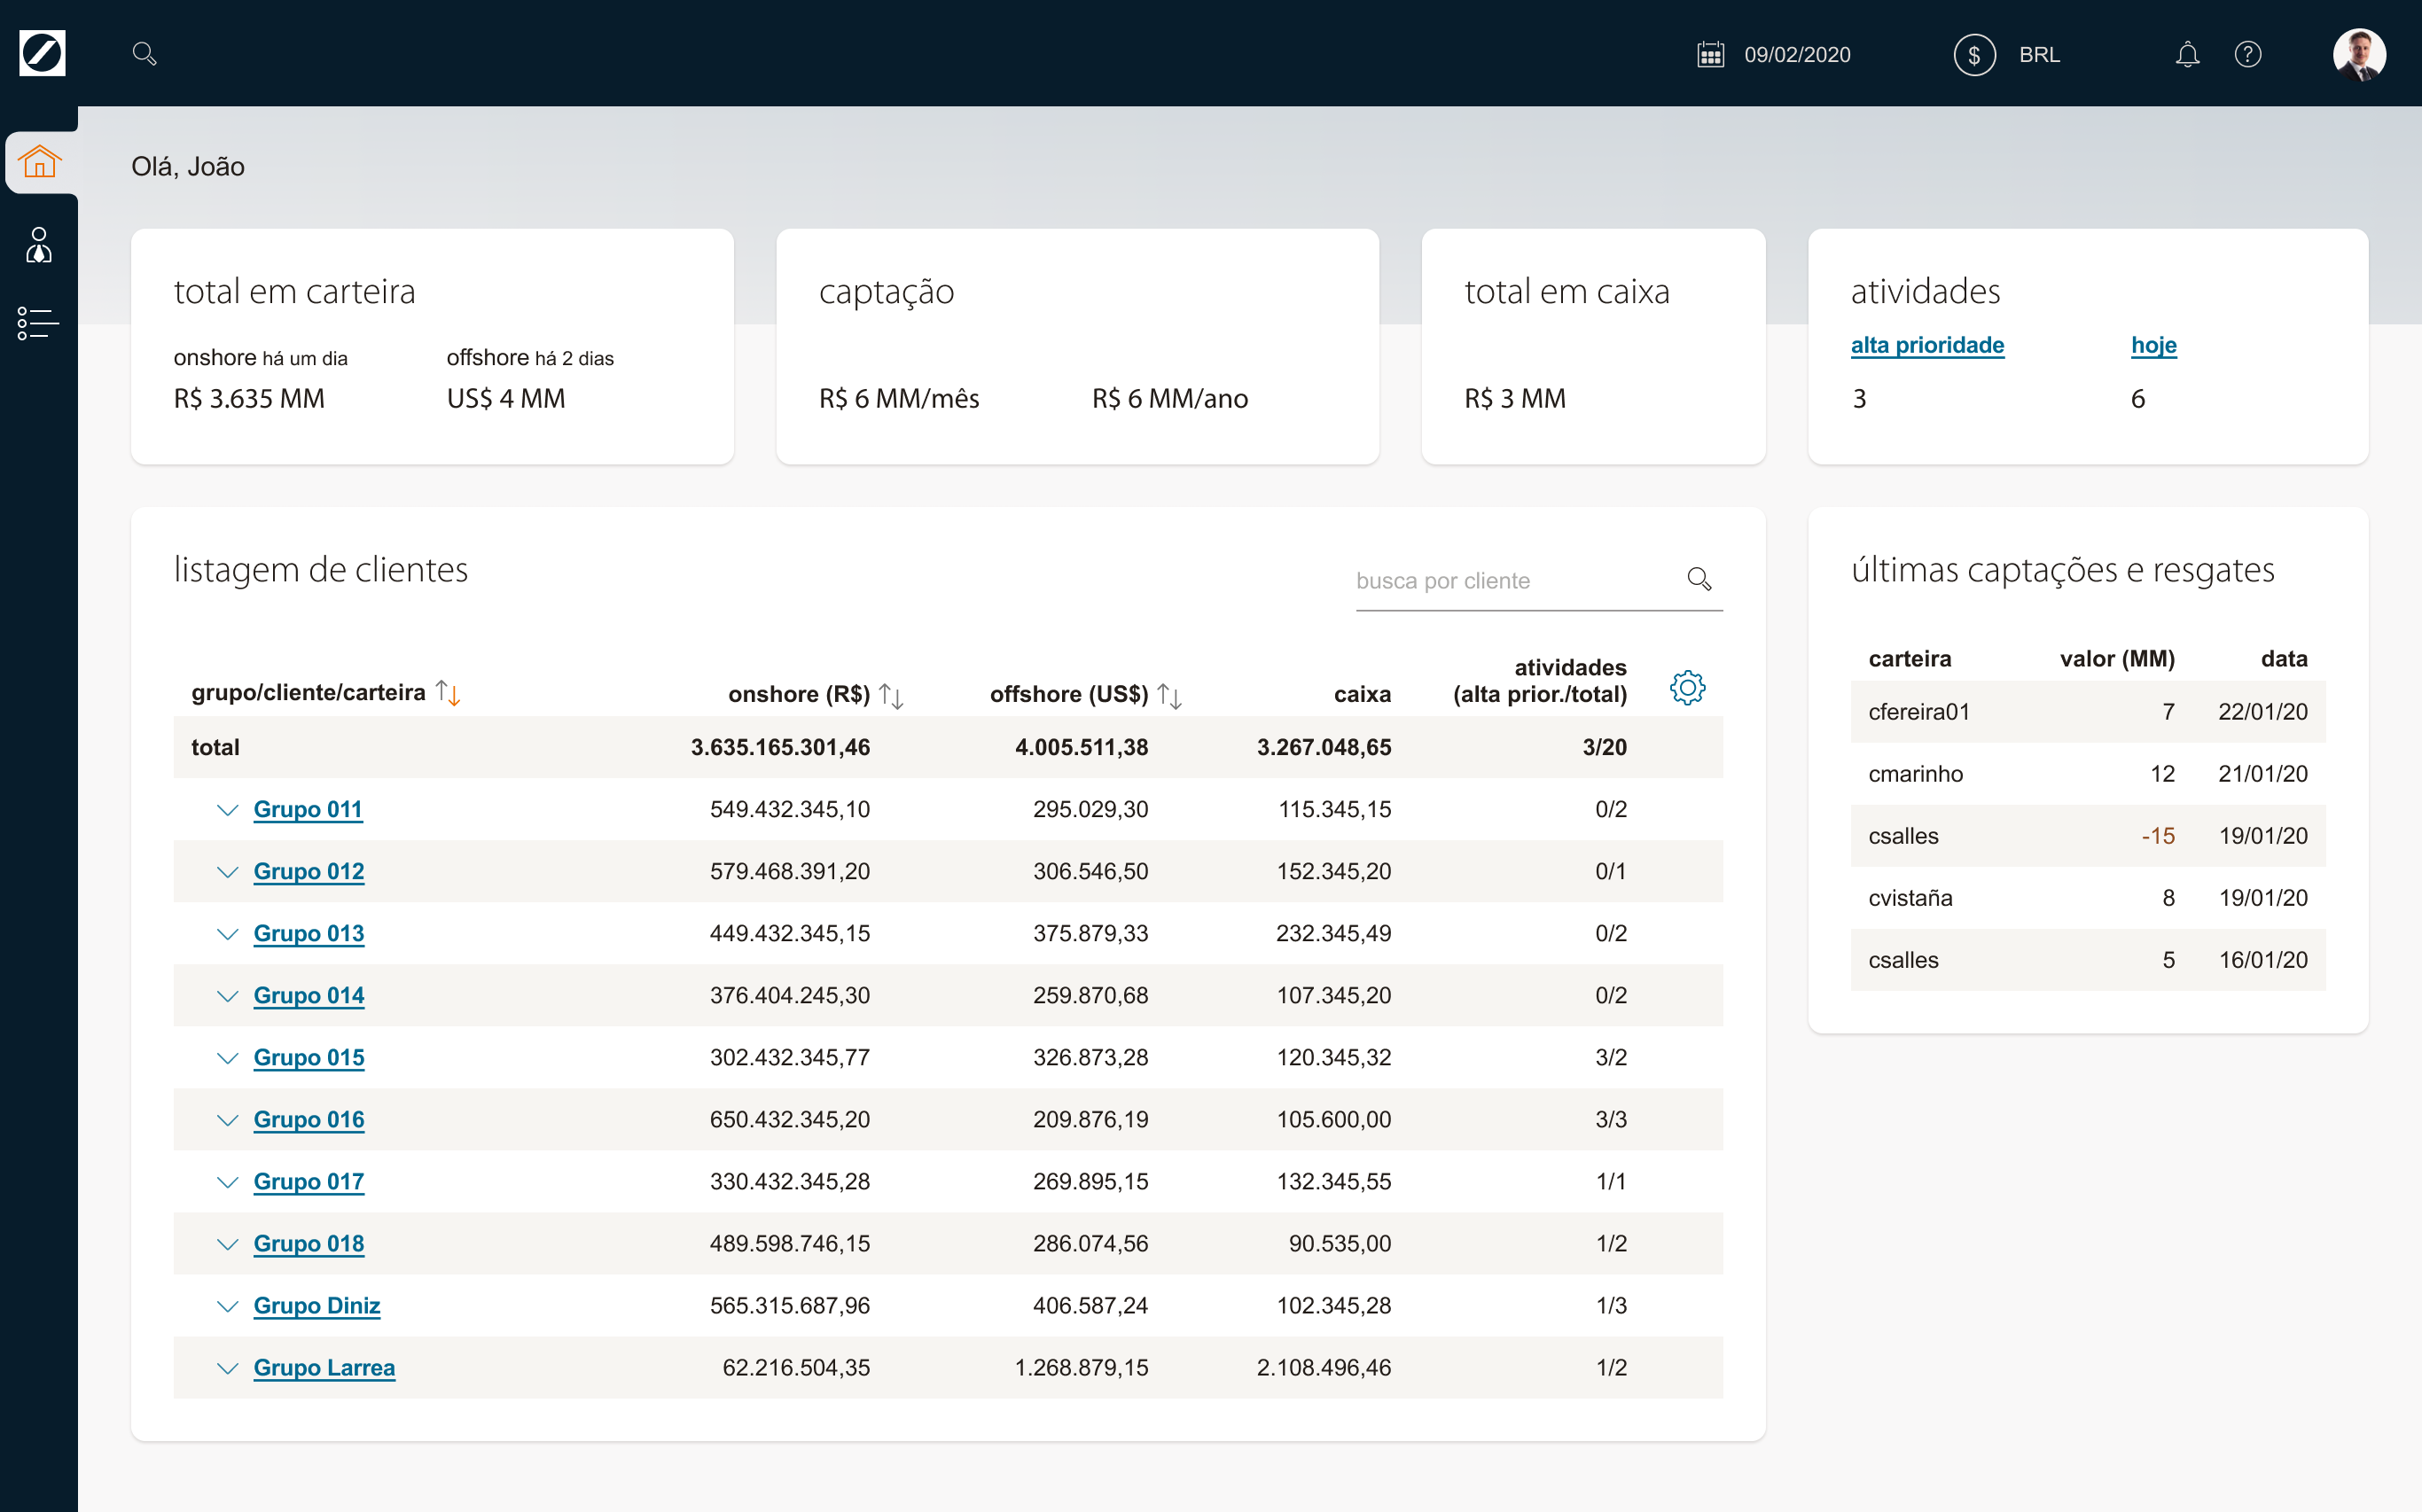
Versão final da home
Não foi feita versão para celular pois todas as partes do projeto pediam muita informação em tela e os especialistas de investimentos usualmente faziam reuniões com seus clientes usando computador ou iPad.
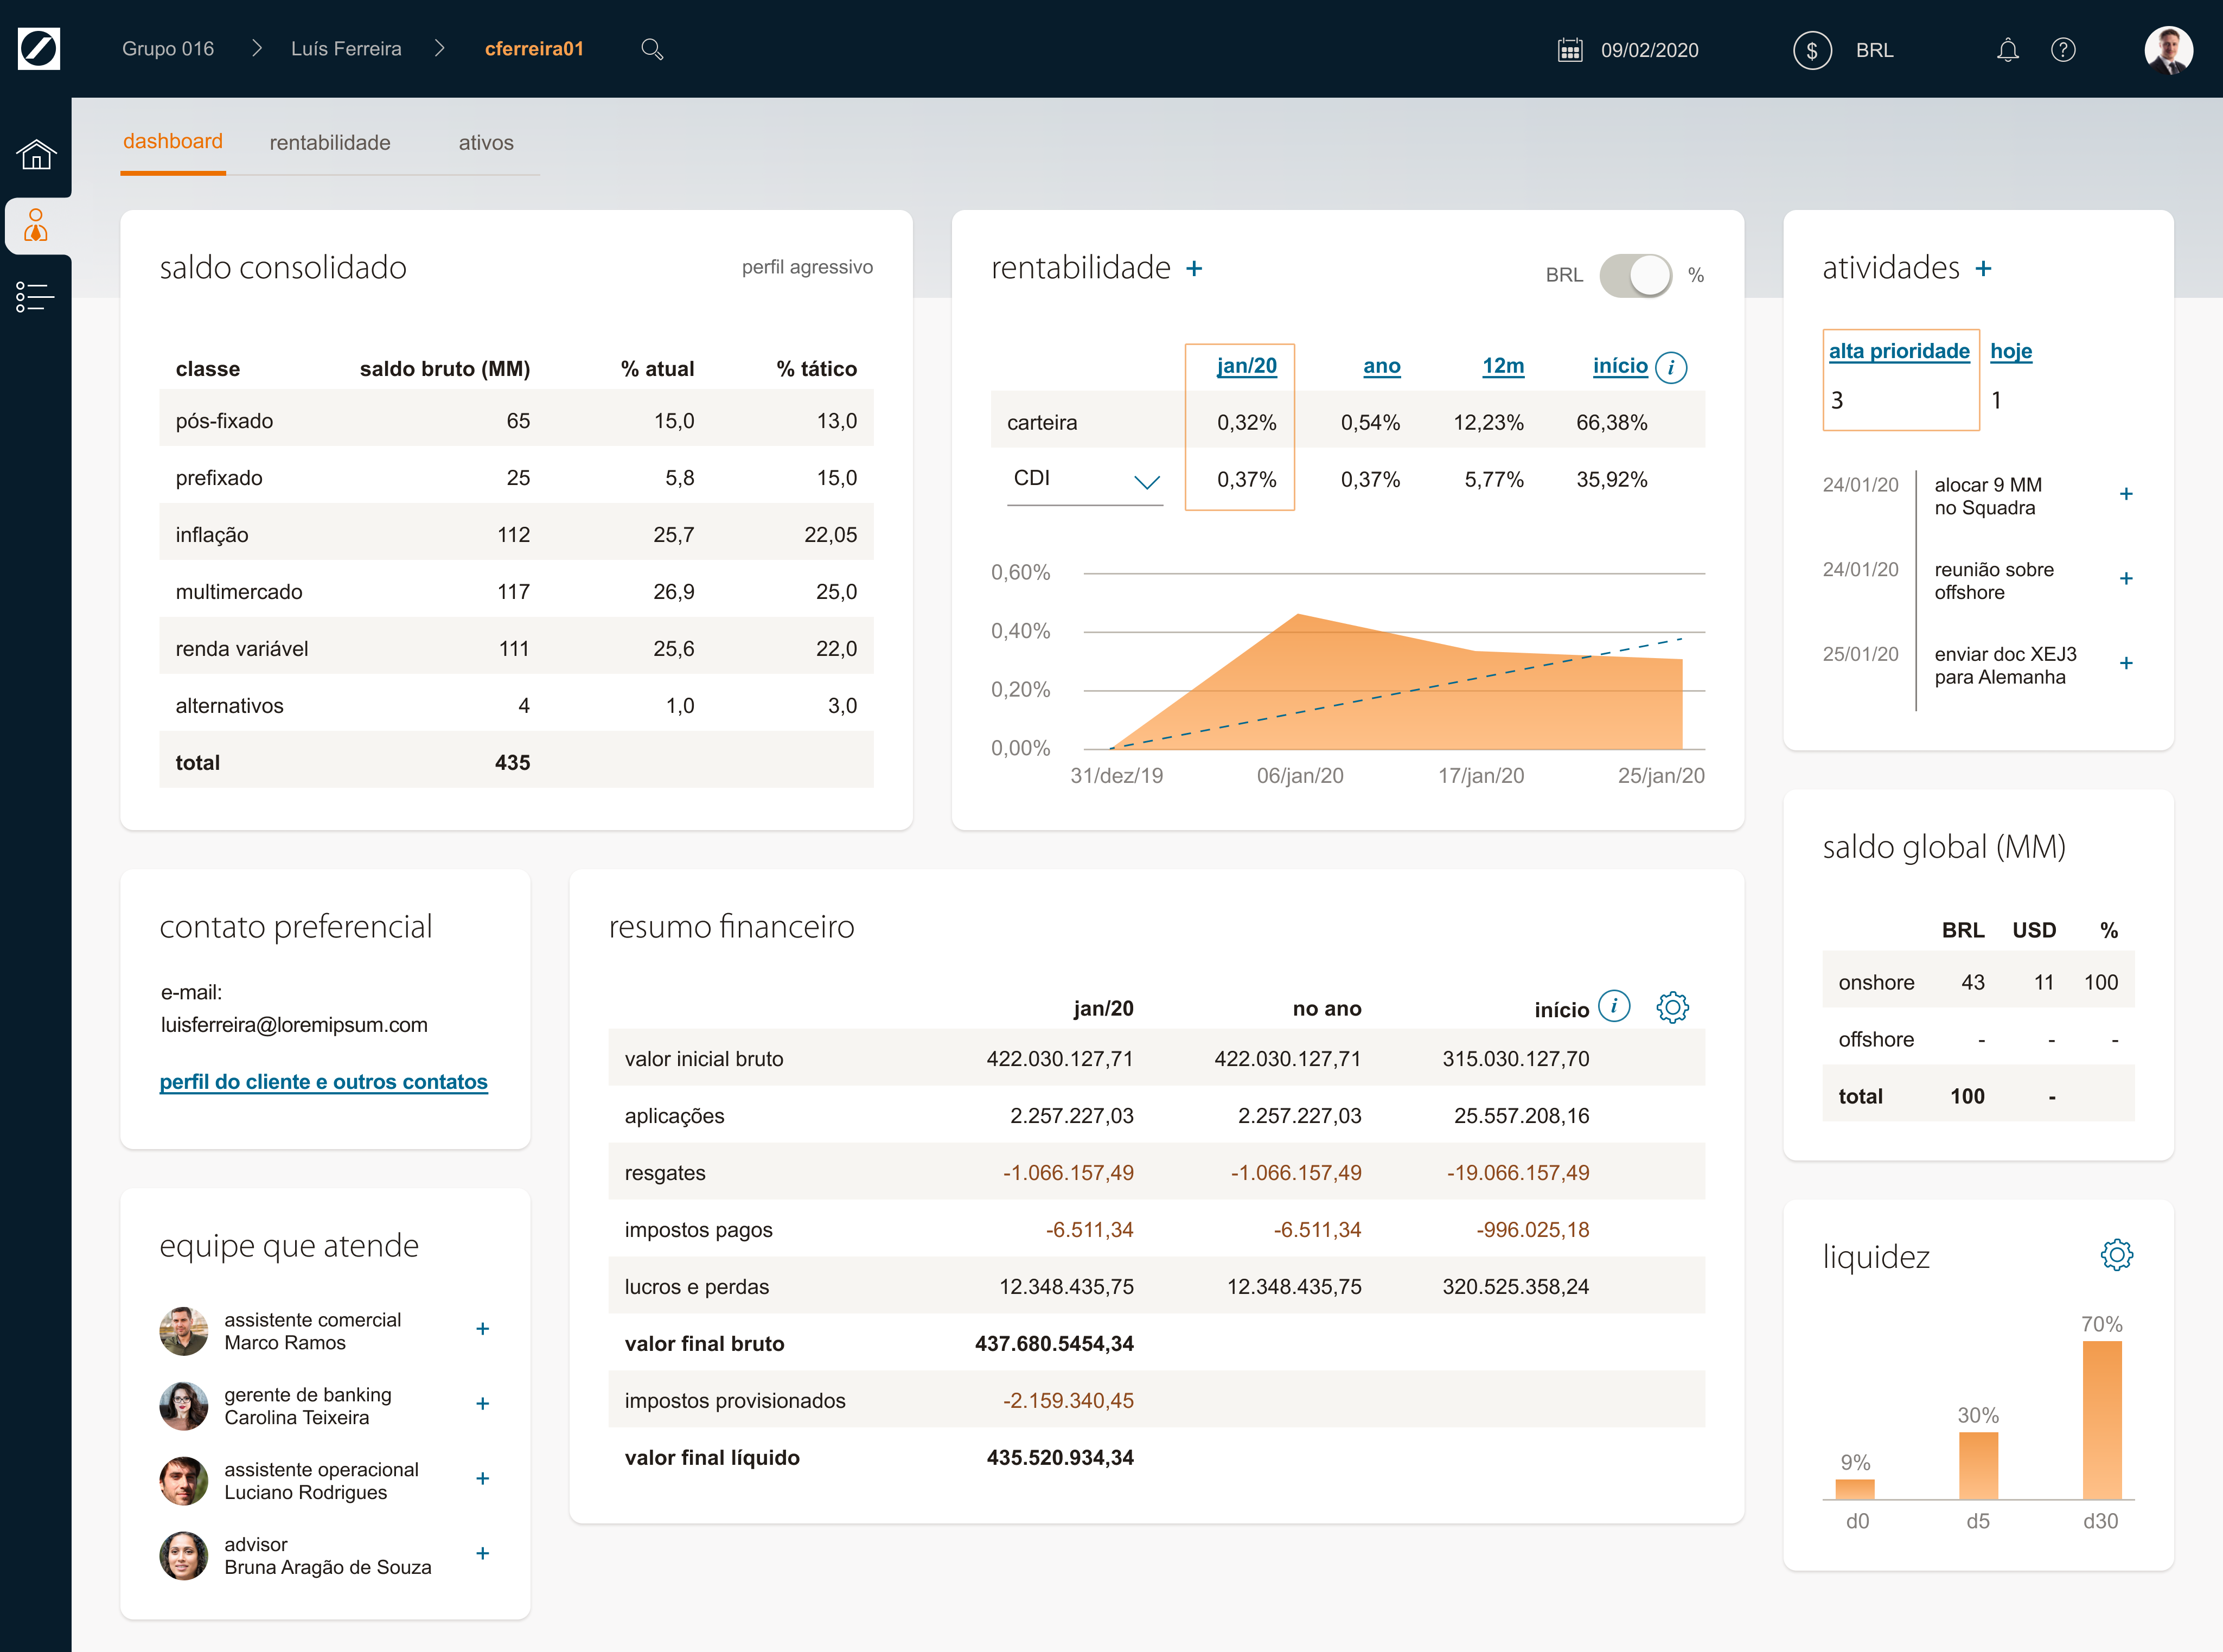
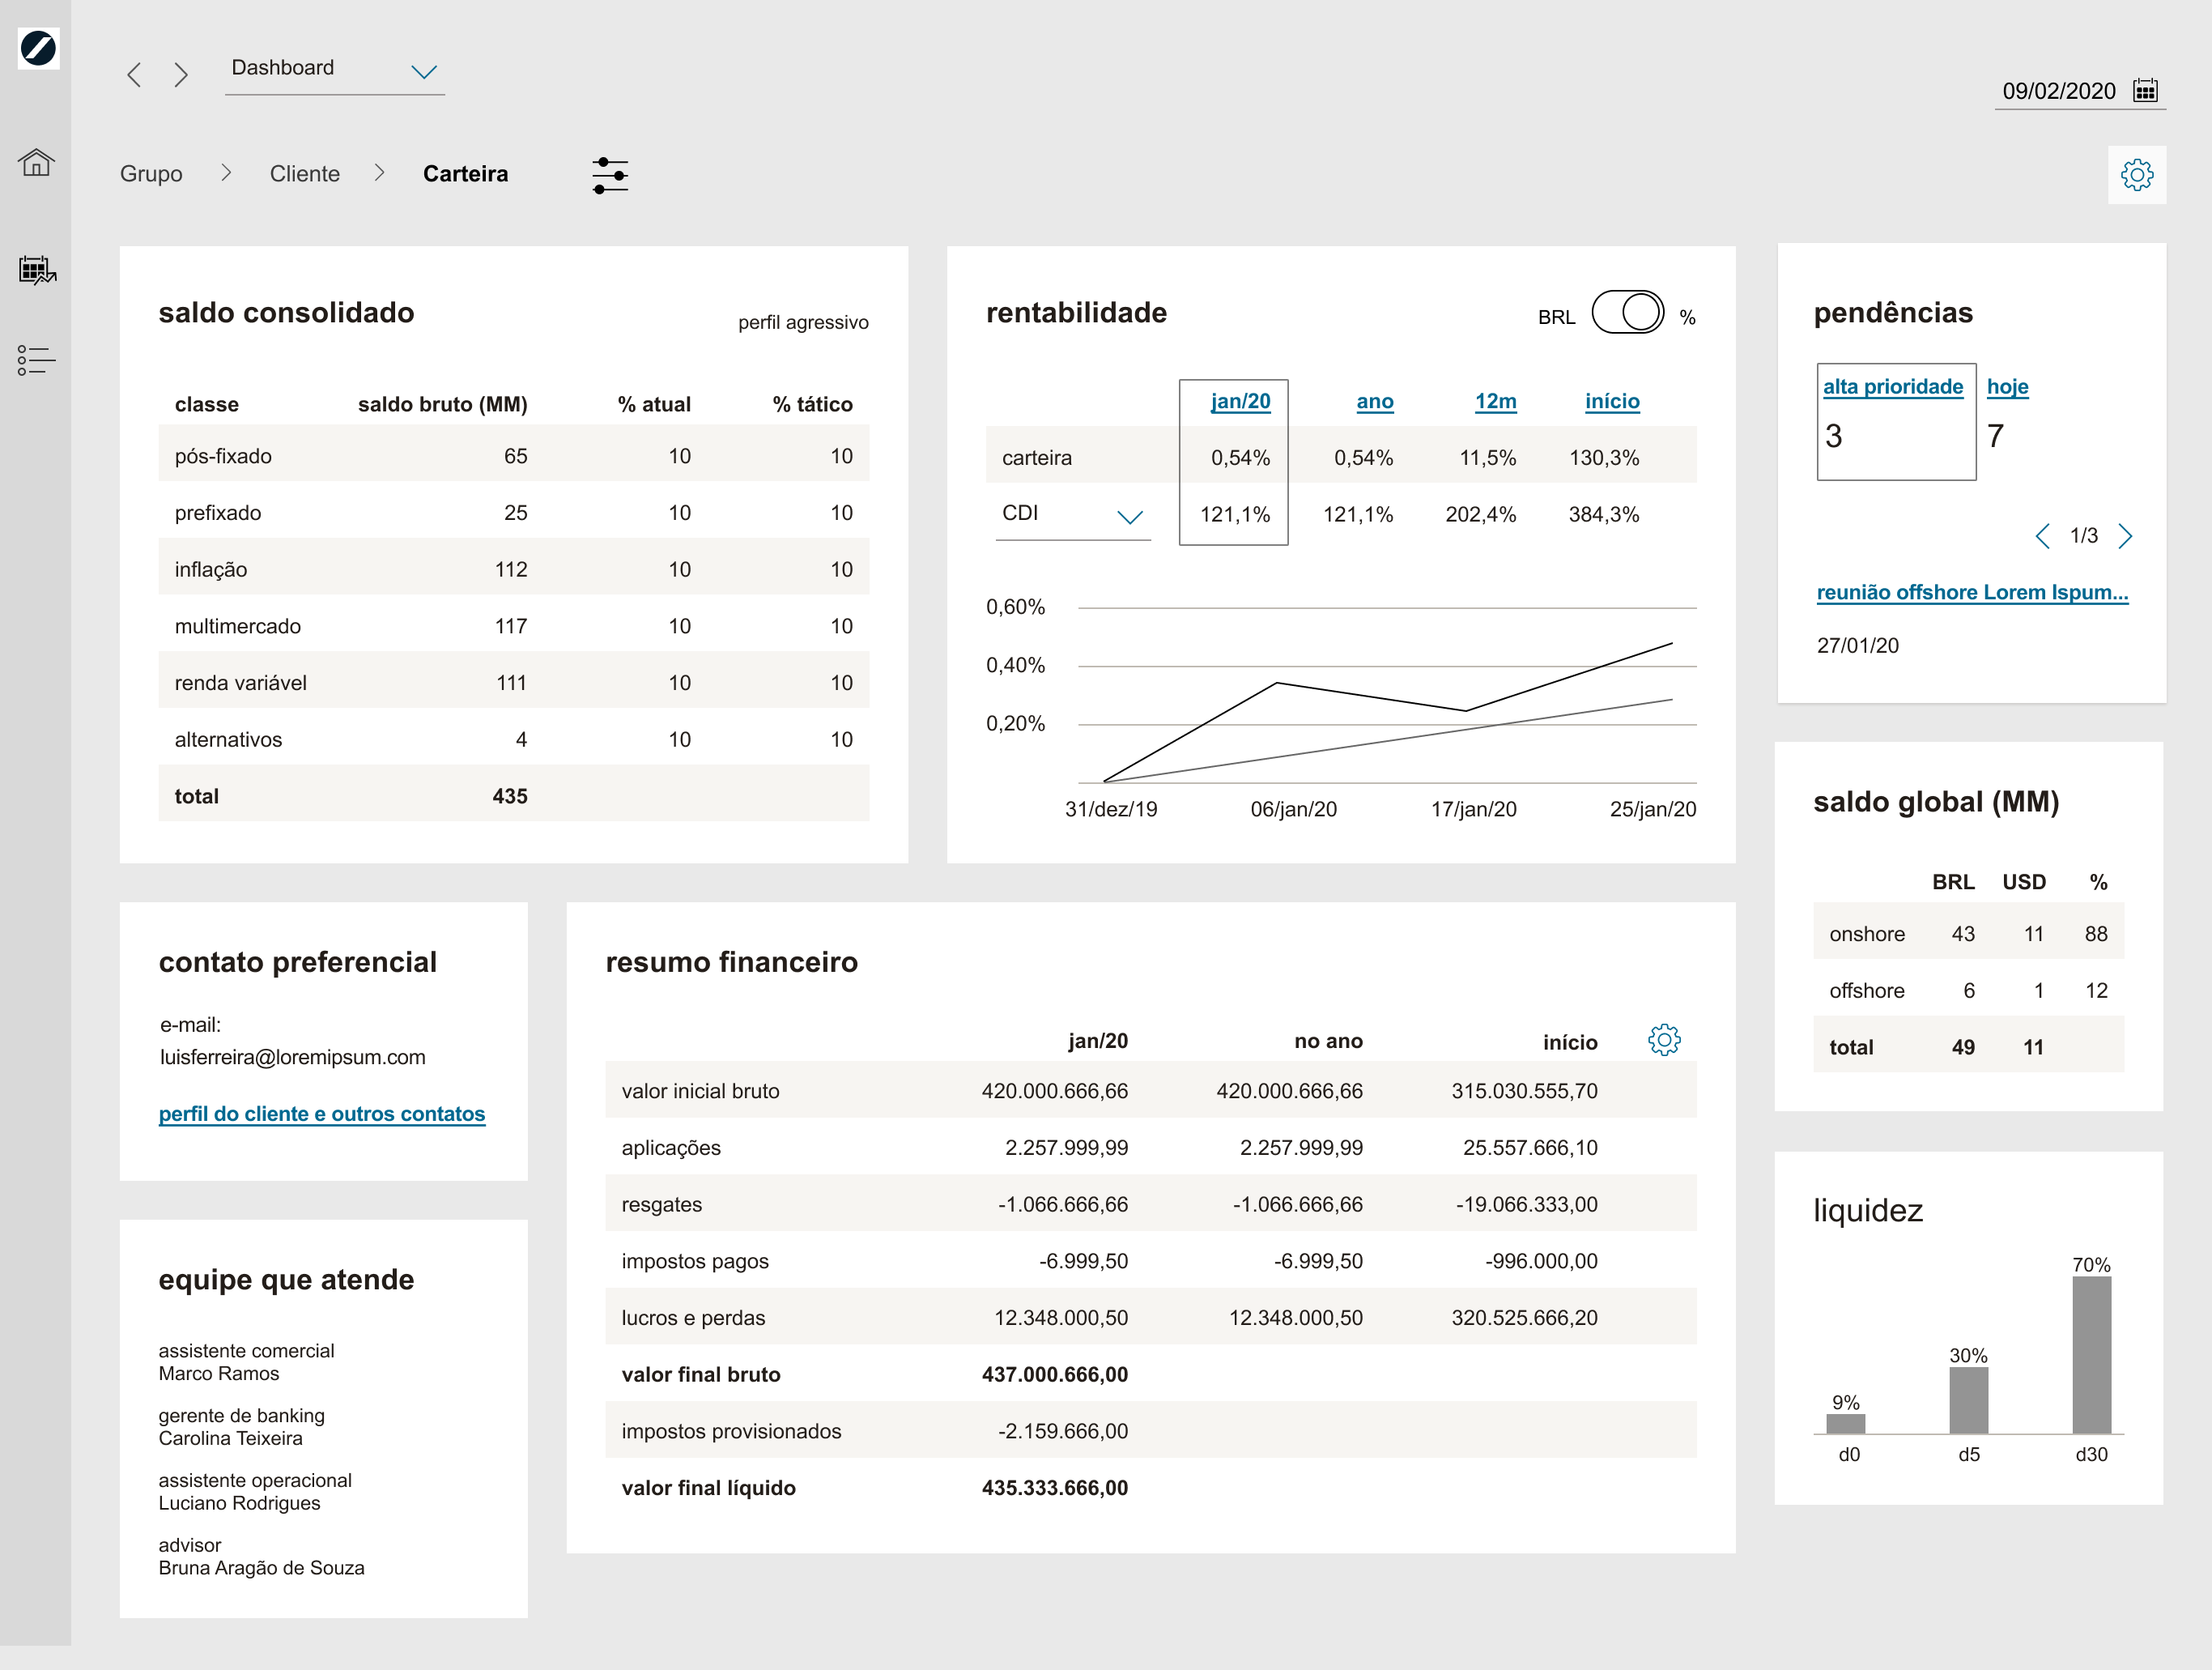
Versão final do dashboard geral de uma carteira
Junto com os dashboards, a home foi desenvolvida. Porém, no início apenas a listagem de clientes foi feita. No dashboard, a ideia inicial, de permitir que os cards pudessem ser mudados de lugar (drag and drop) não foi implementado por não ser prioridade.
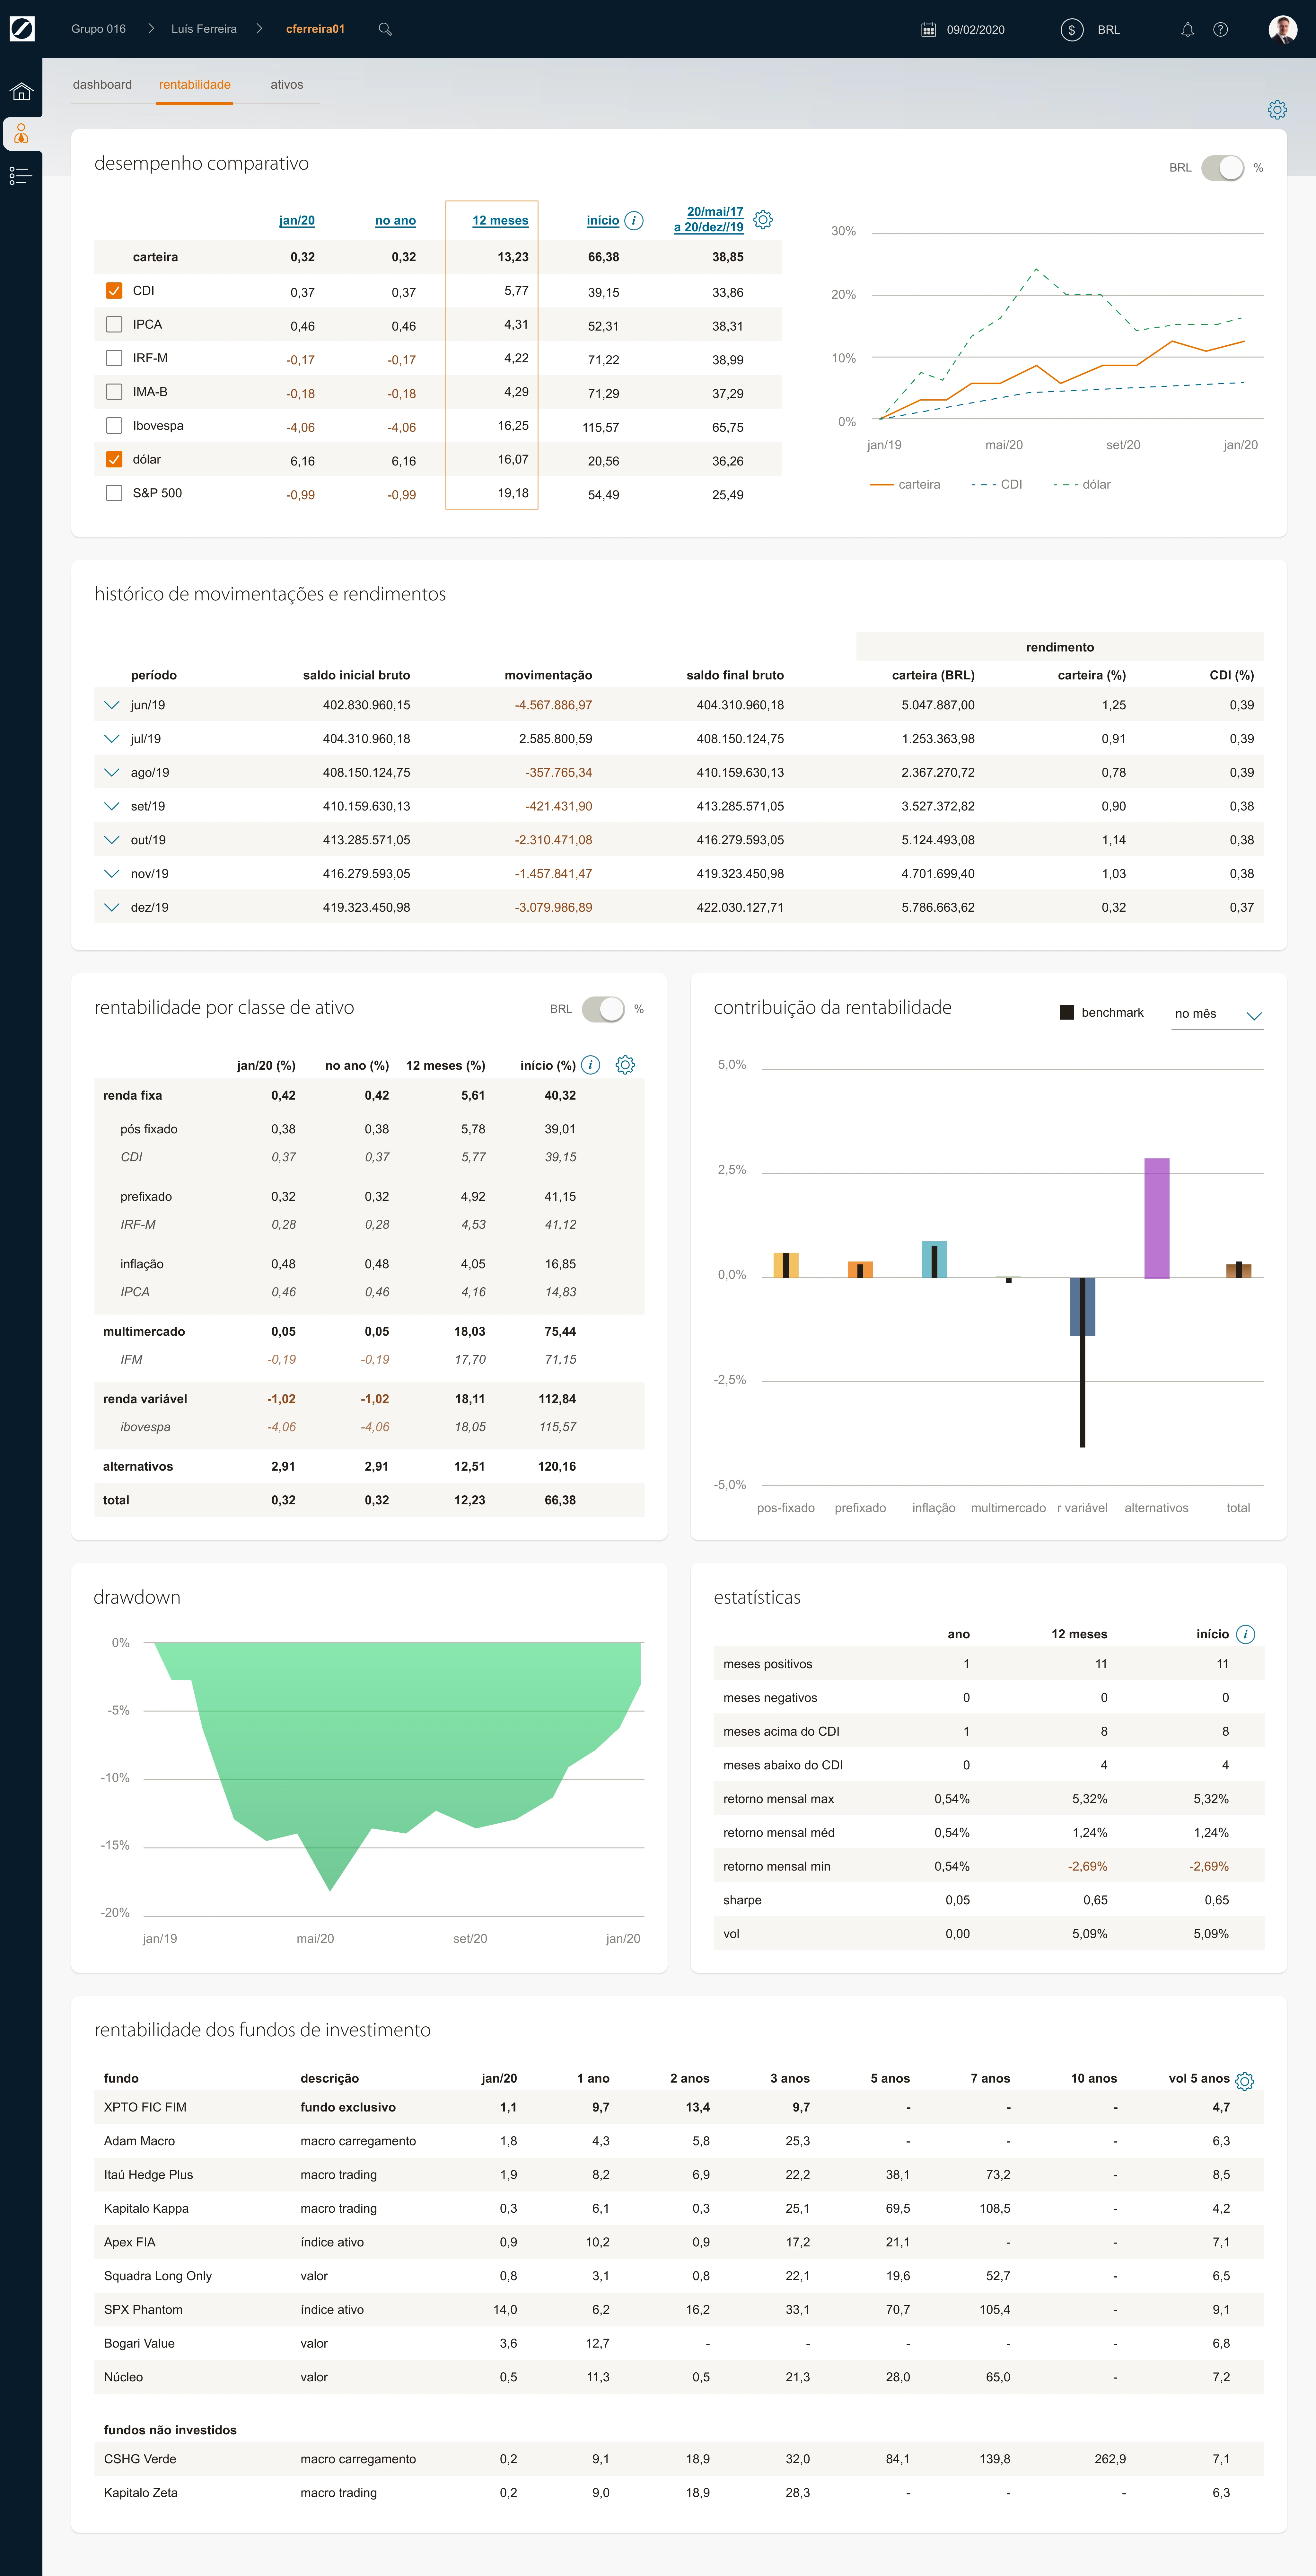
Versão final do dashboard de rentabilidade
A divisão dos menus em três partes: menu lateral, breadcrumb e abas. O breadcrumb que atua como busca/treeview. O breadcrumb/treeview e a busca atualizam informações na mesma tela, sem troca de página, usando animações de "skeleton" para carregar novos dados.
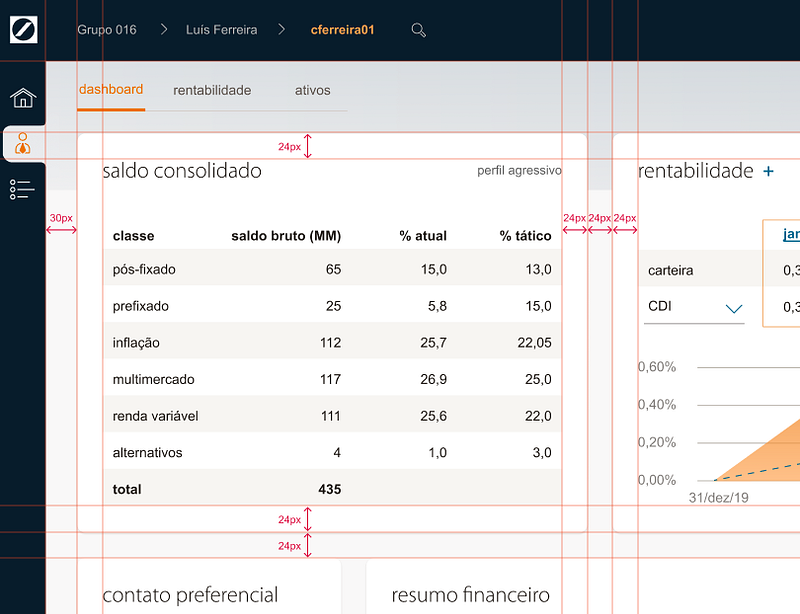
Detalhes dos espaçamentos e alinhamentos
Na barra superior, o calendário abria um date picker que permitiria ver a carteira do cliente em outro ponto no passado. O foco inicial no desenvolvimento foi fazer o mínimo da home e dos dois dashboards, e então fazer a parte de atividades e atas. O layout em geral seguia cards com distância de 24px entre eles. Espaçamento interno (padding) também de 24px. A distância horizontal das bordas dos cards é de 30px.
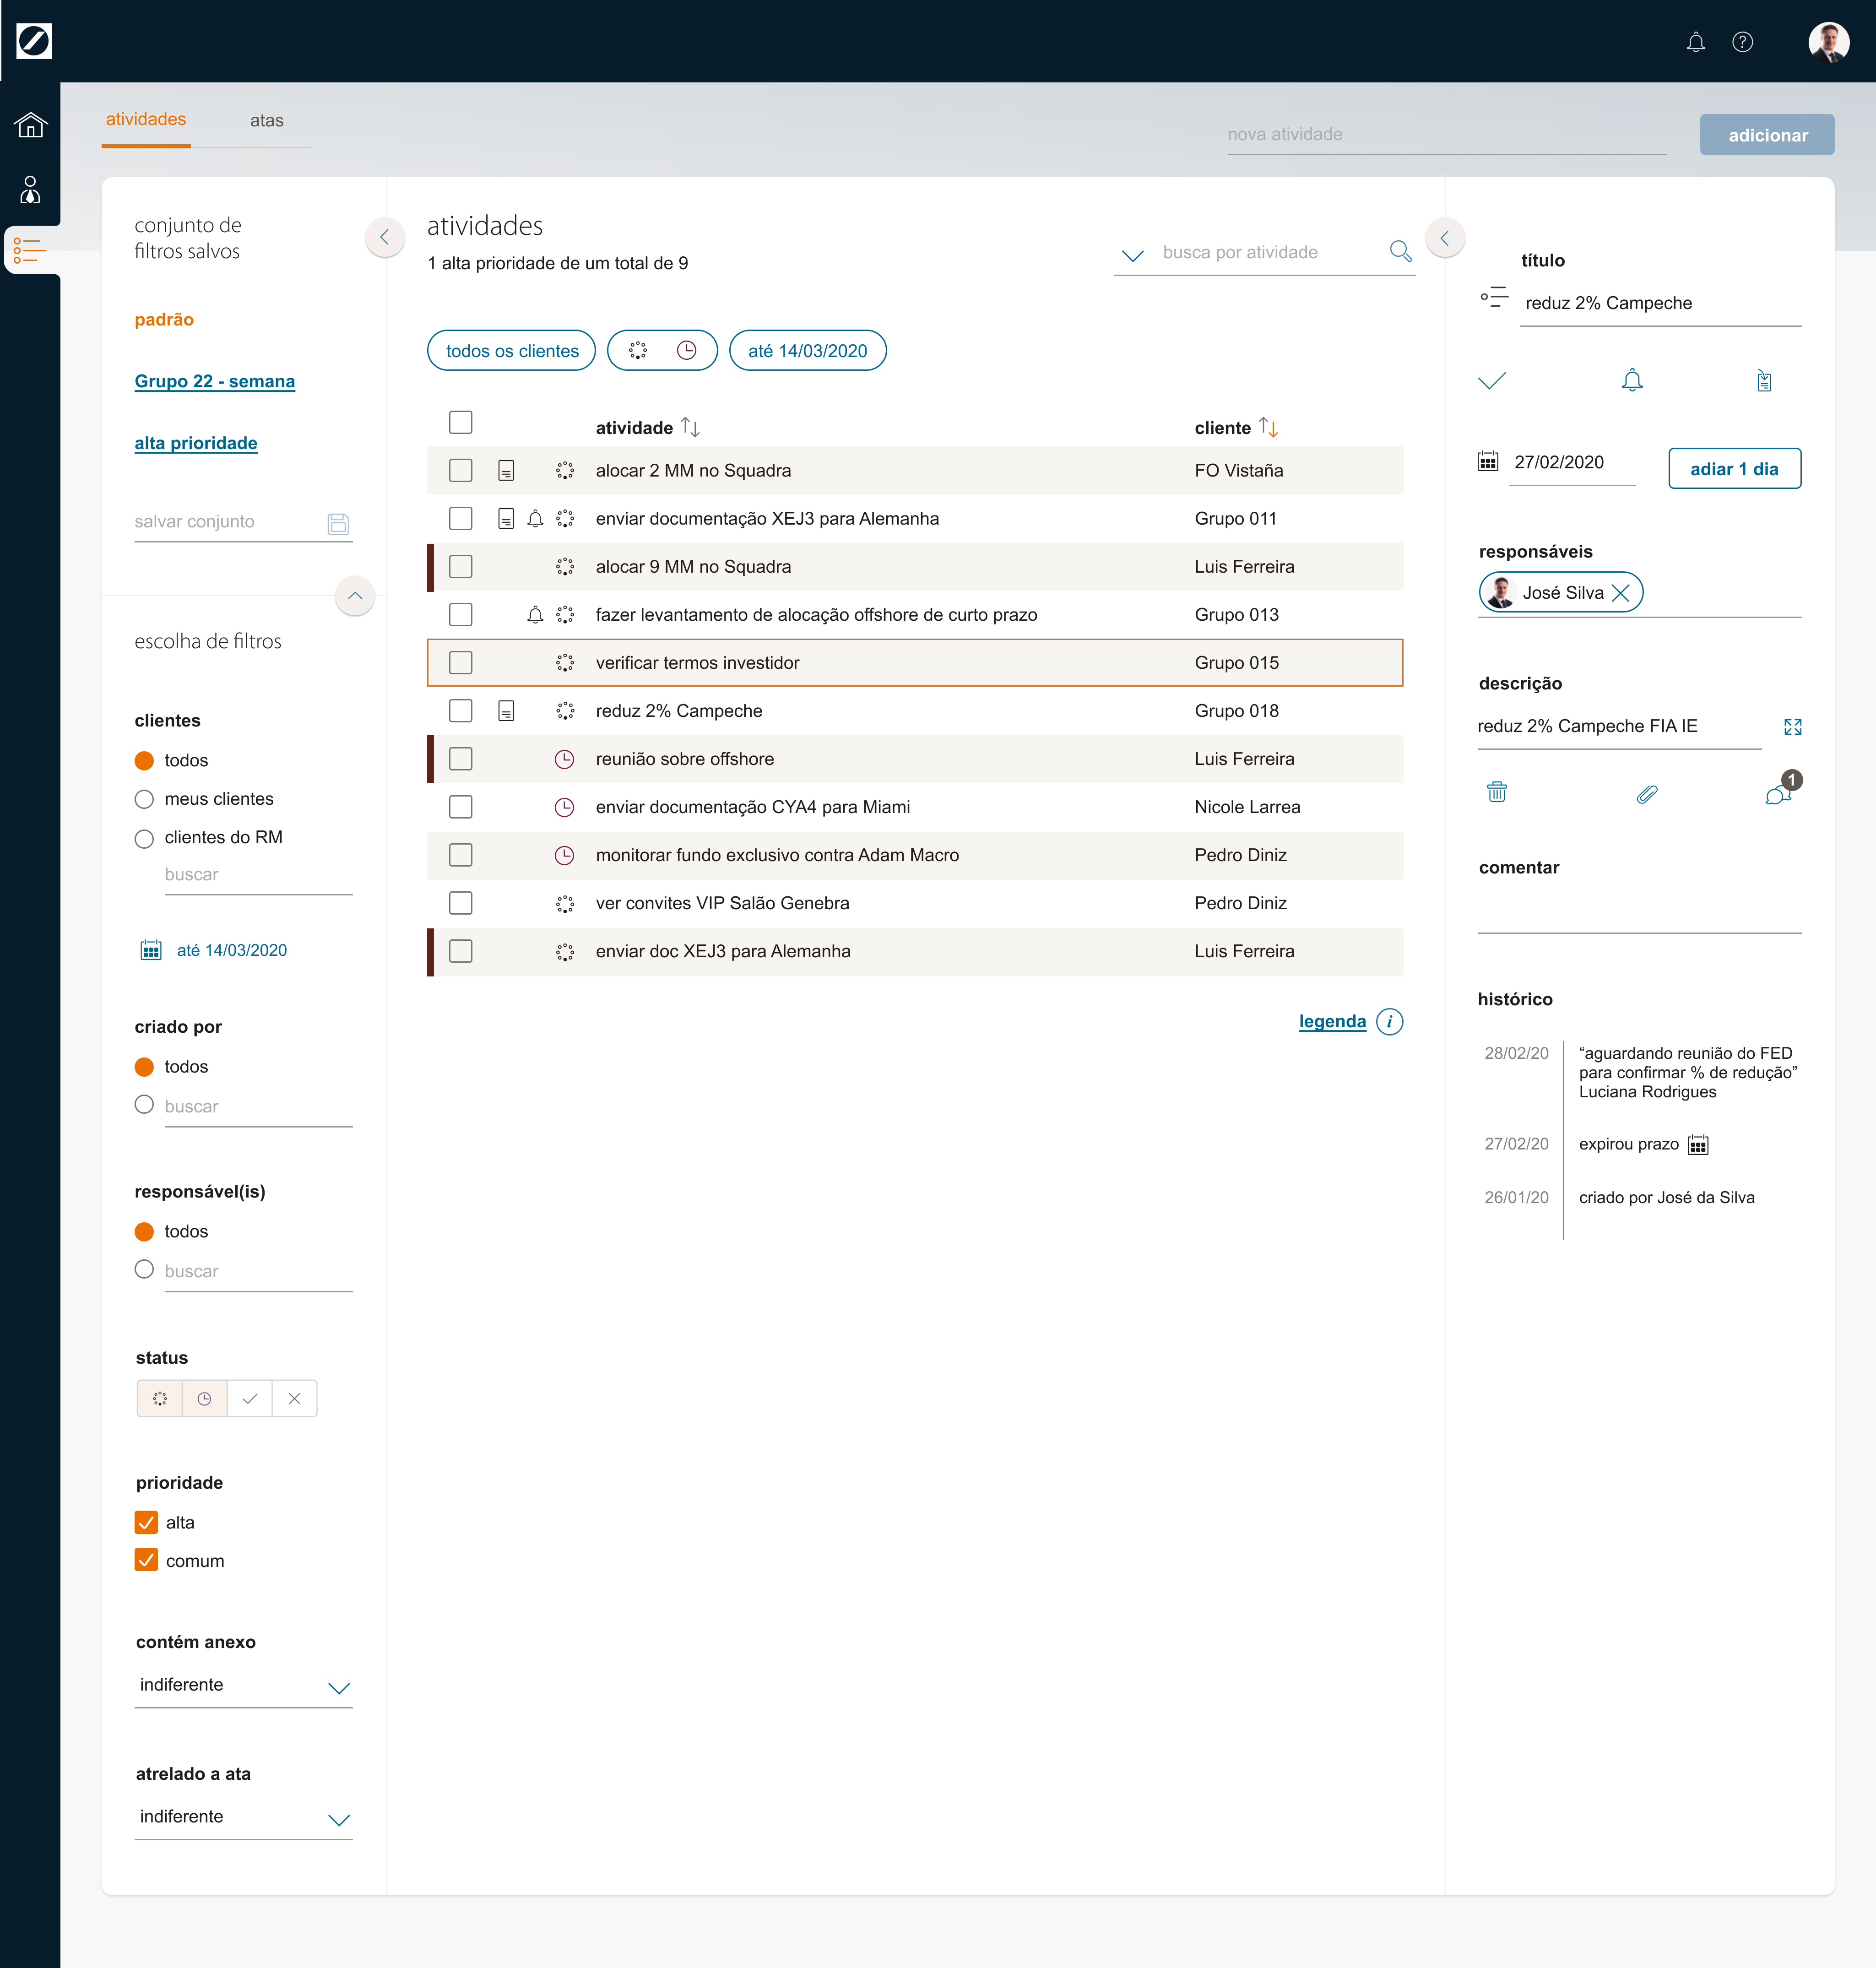
Versão final da tela de atividades
A primeira tela a ser desenvolvida por completo foi a de atividades, seguida pela de atas. A tela de atividades organiza tarefas para o cliente, que podem aparecer em atas de reunião e possuem quatro status (em andamento, atrasadas, feitas, excluídas), cada um com um ícone. As atividades podem ser delegadas, conter descrições detalhadas, anexos e comentários da equipe. A tela se tornou mais complexa devido a demandas de stakeholders.
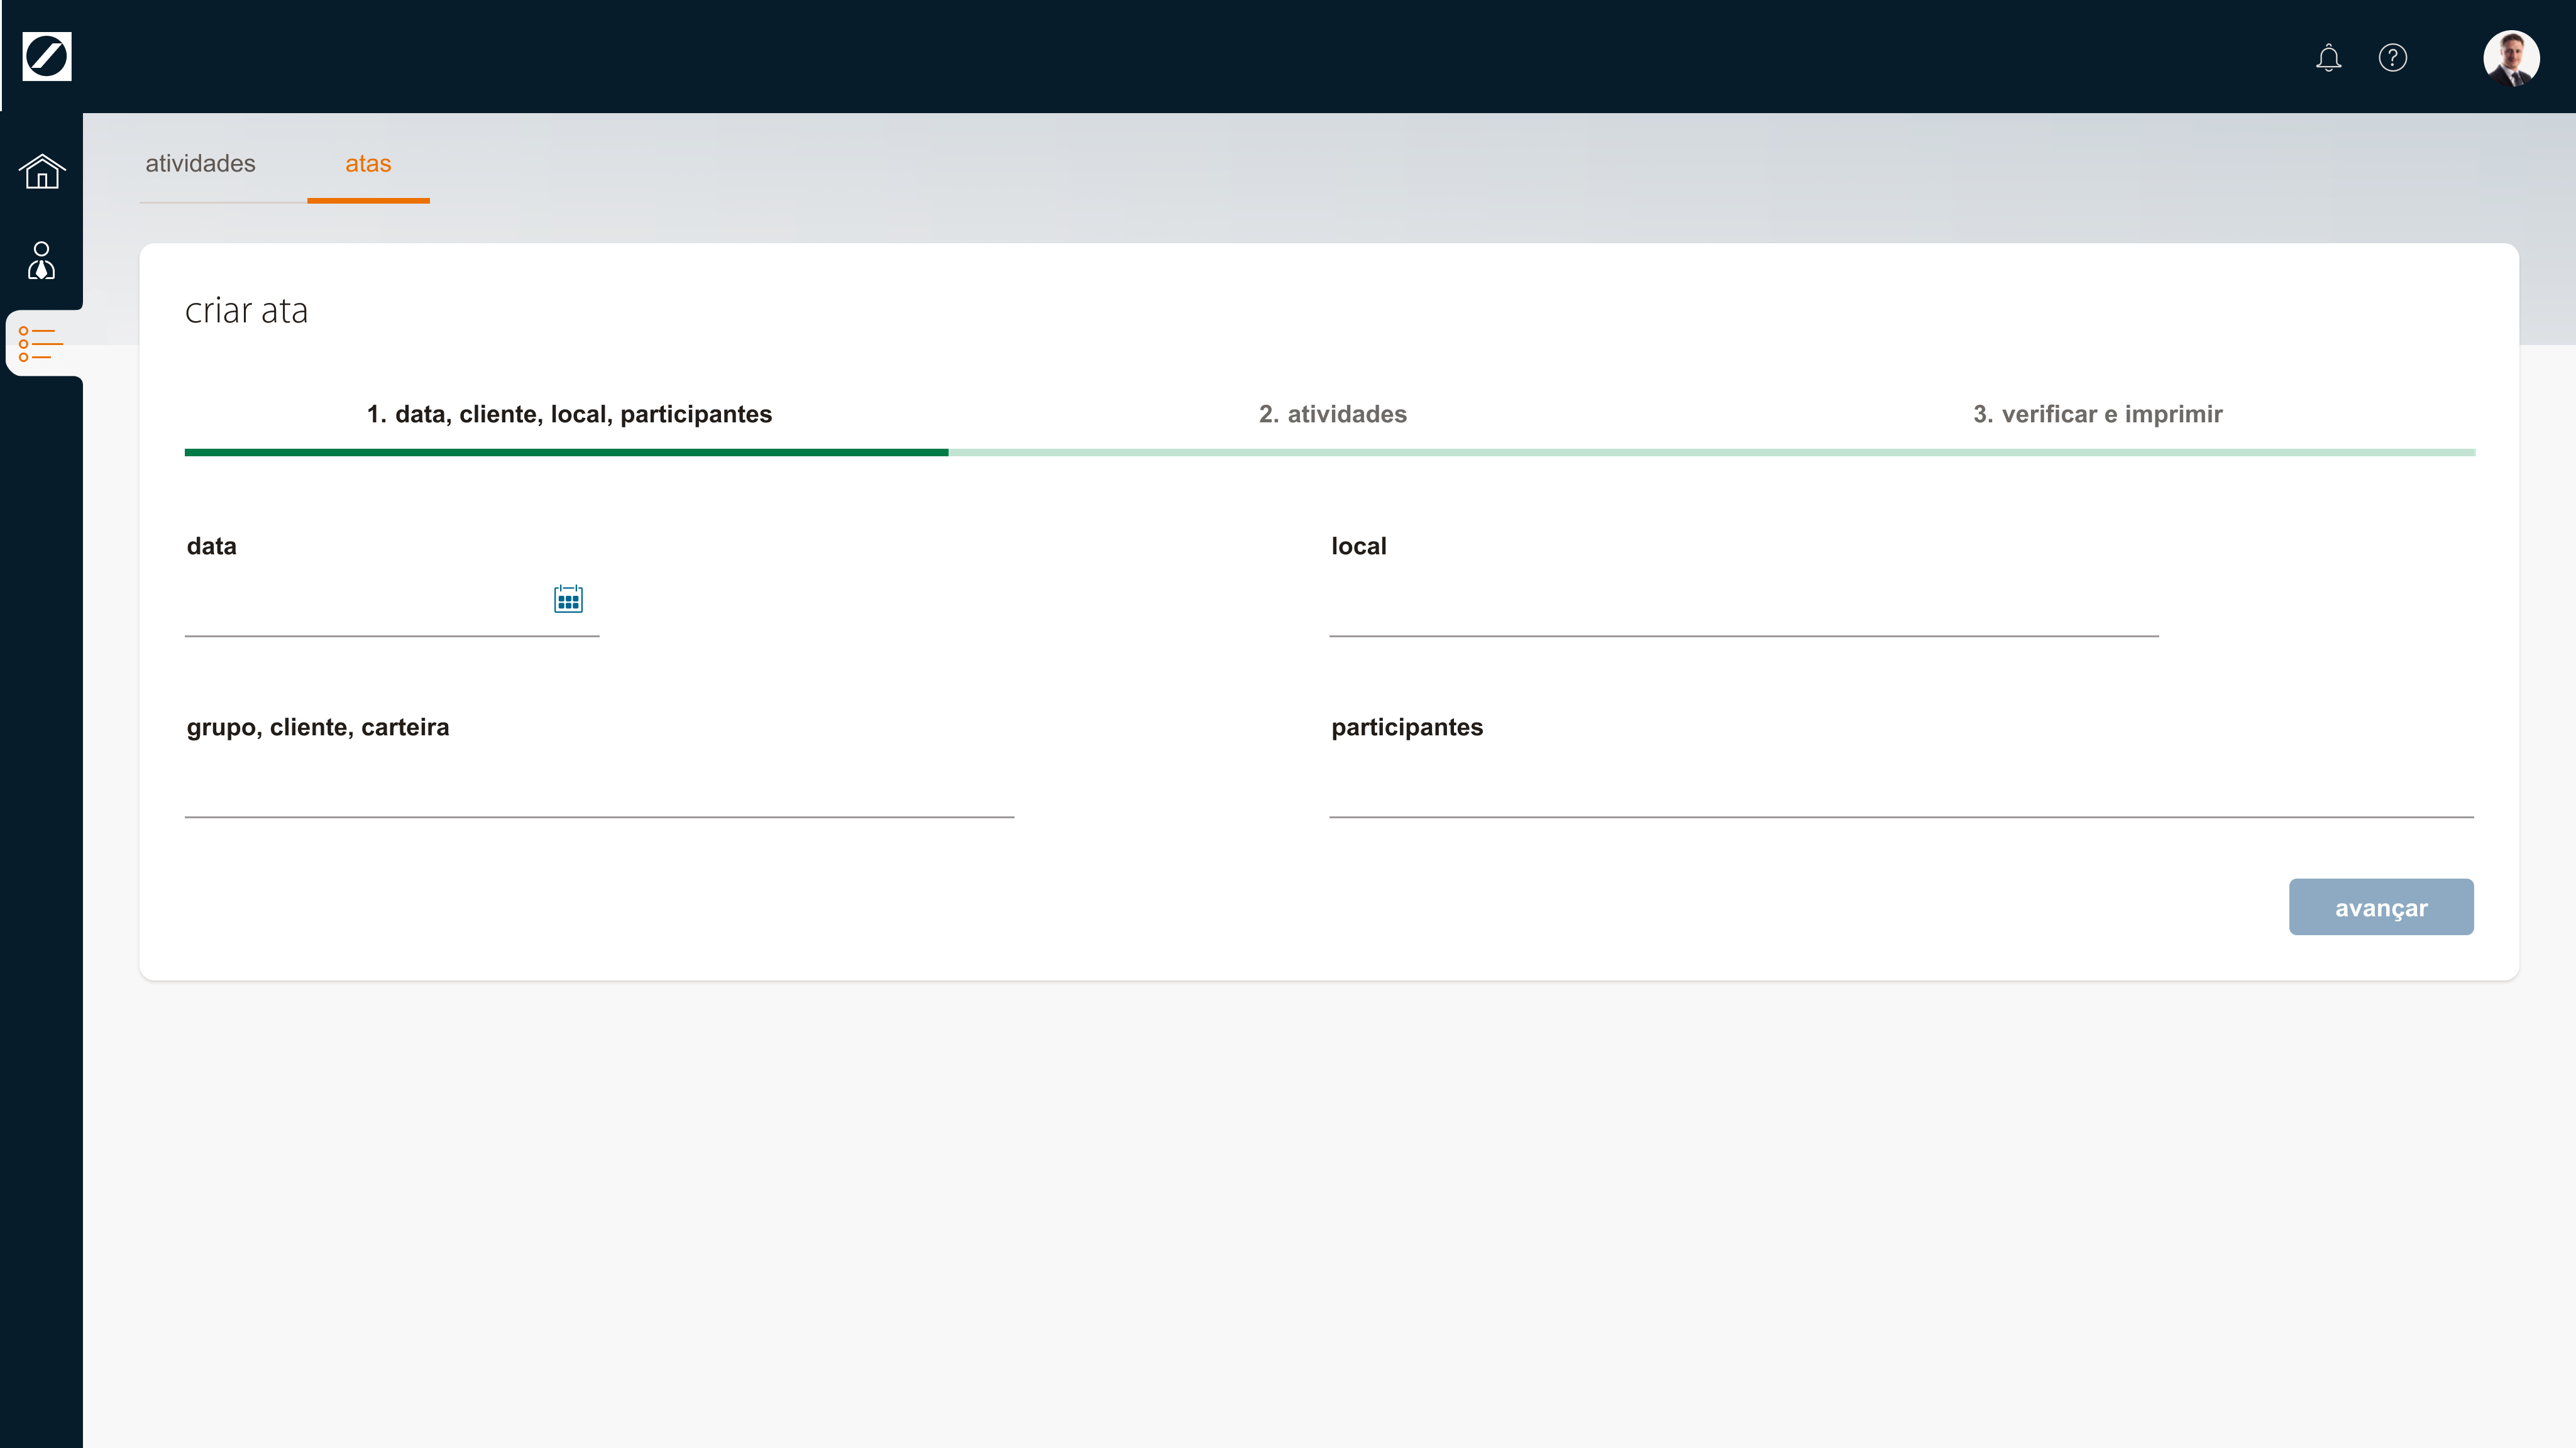
Versão final da tela de atas, no passo 1
O fluxo de atas é o que possui telas mais simples no projeto todo. São 3 passos. No passo 2 novas atividades podem ser criadas (no momento da reunião) ou podem ser incluídas entre as que já existem. Parte do trabalho foi criar o layout da ata que devia ficar bem tanto em tela como impressa.
A parte 2 do projeto, de ativos, contém a tela mais complexa de ser entendida e desenvolvida por possuir grande quantidade de customizações, filtros e opções possíveis. Colunas podem ser reordenadas ou alteradas. Fundos podem ser explodidos (divididos em ativos nos quais investem).
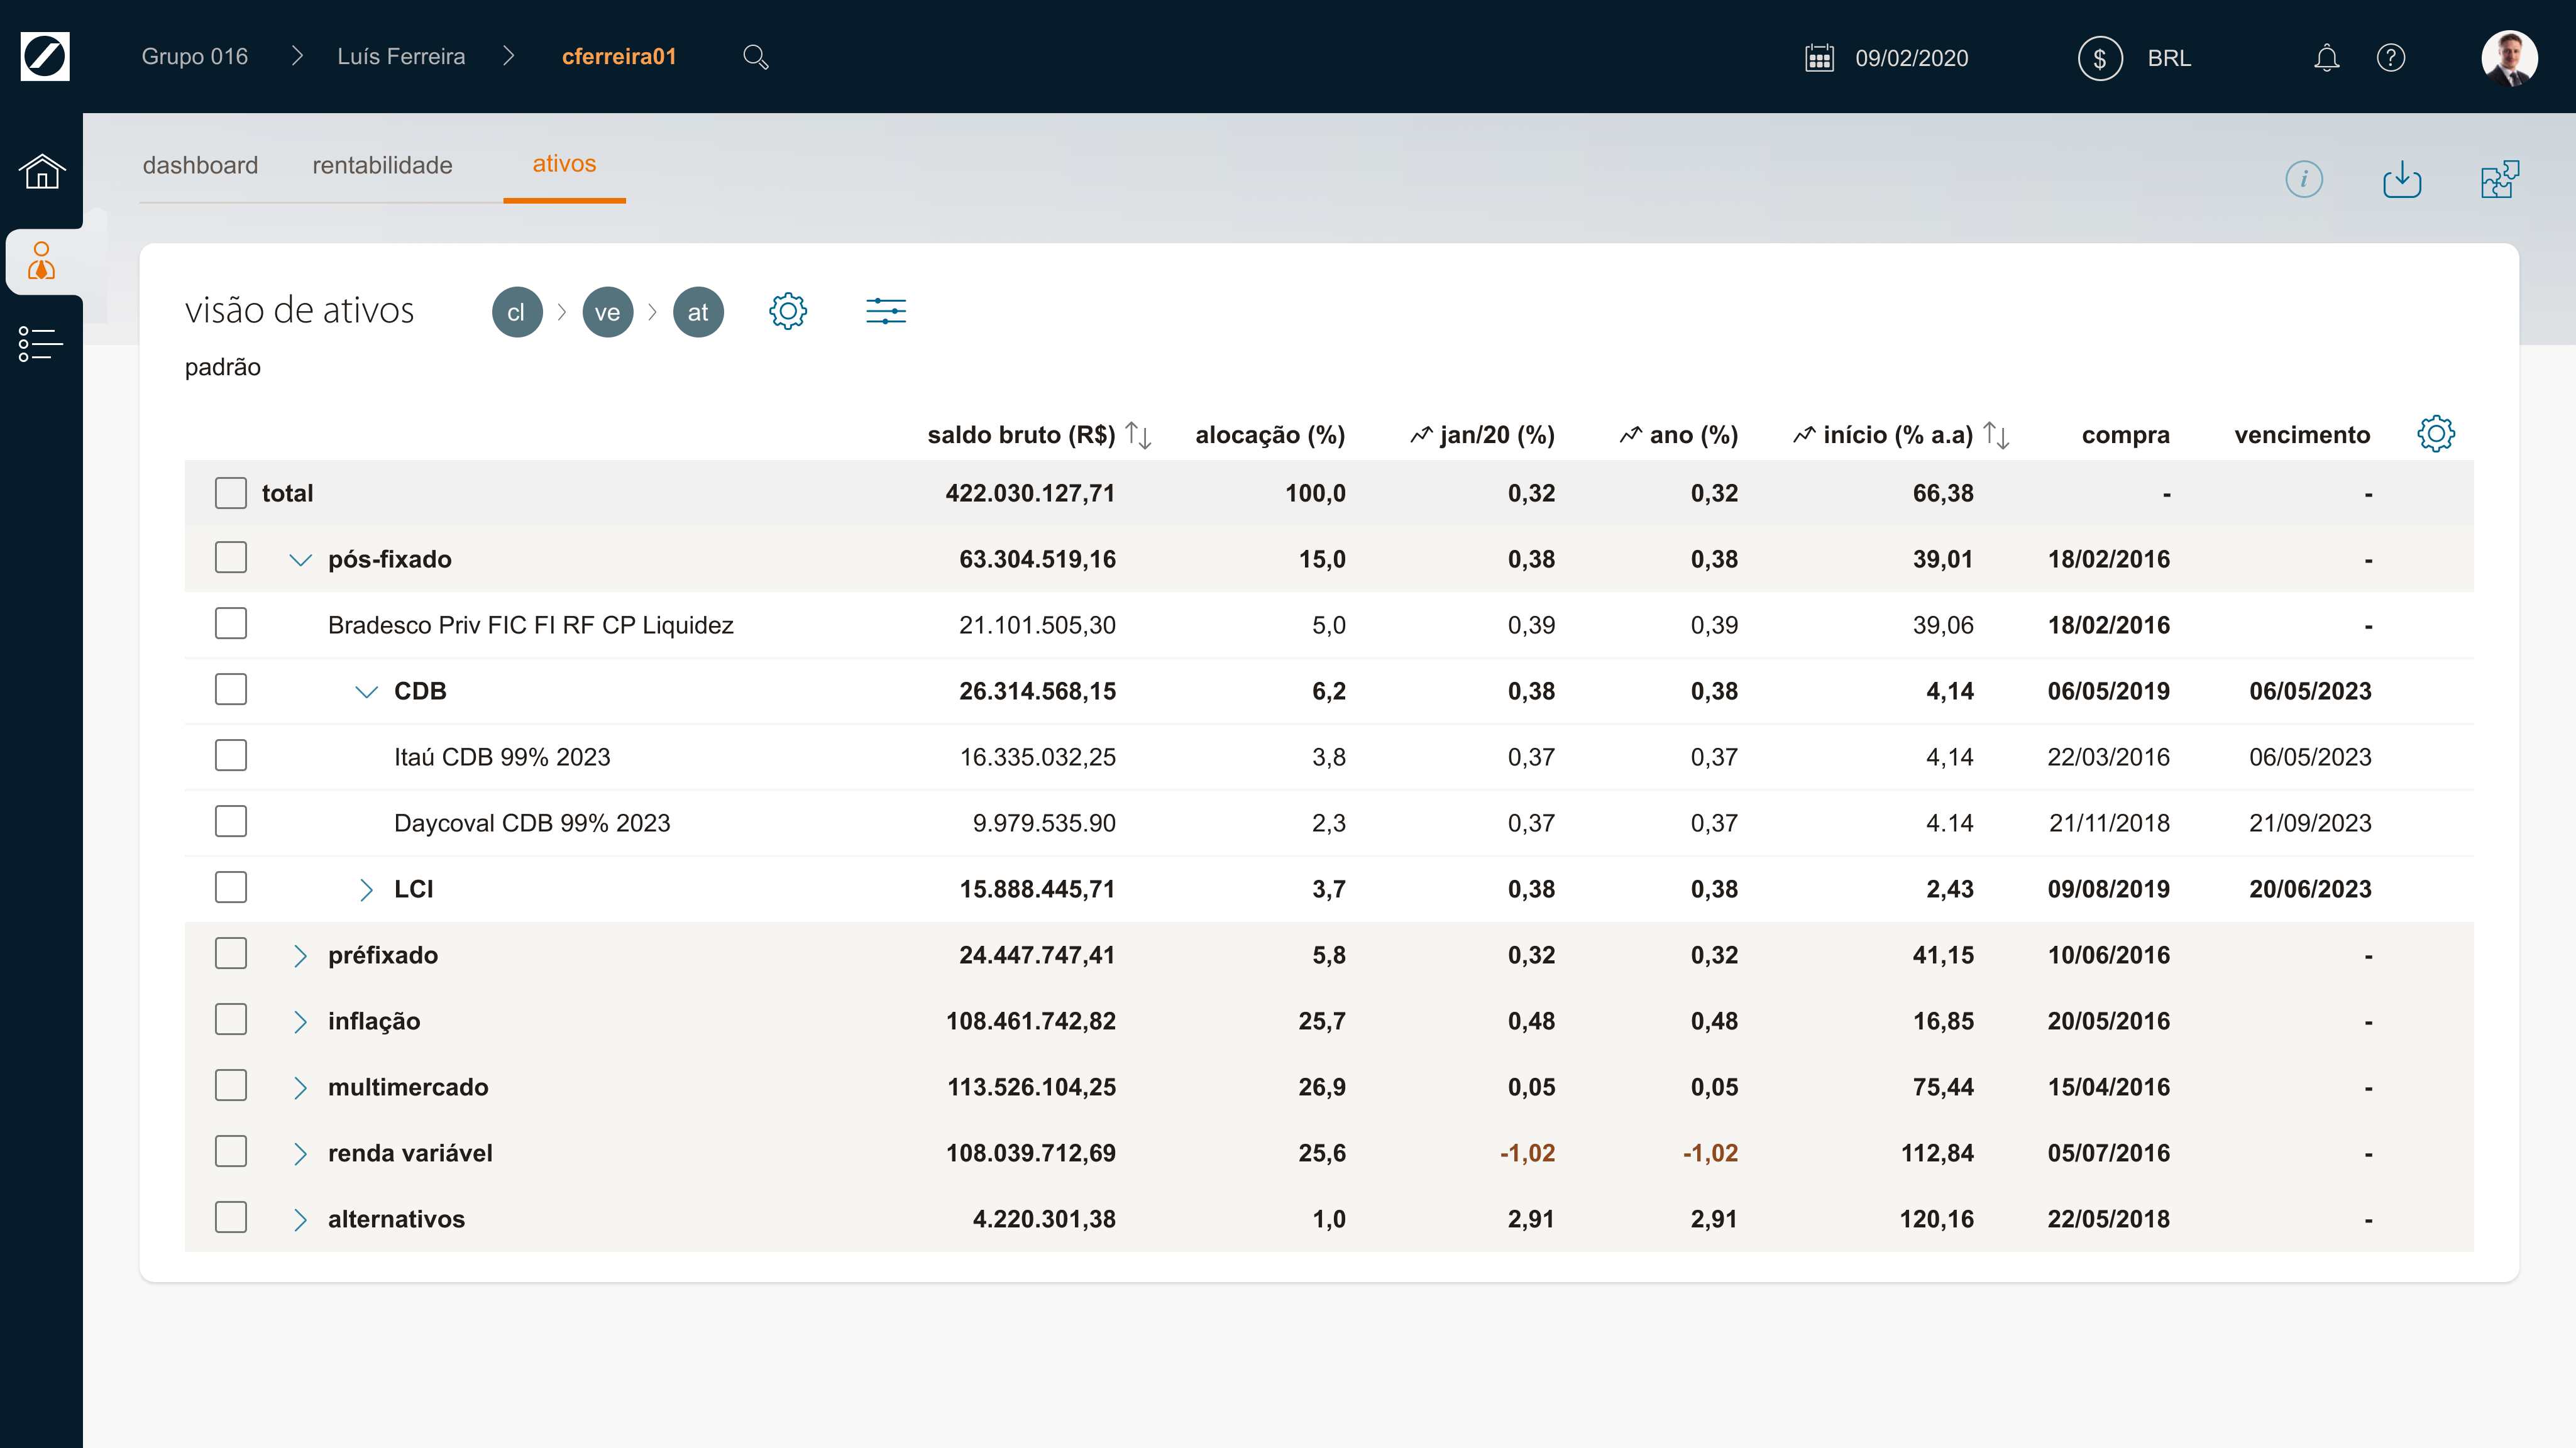
Tela de ativos (parte 2)
A tabela resultante de todos os filtros e customizações pode ser baixada em xls ou pdf. Seria possível criar alguns tipos de campos para ajudar em classificações e filtros.
A parte 3 se trata de um editor de apresentação/documento que é levado para a reunião. Inclui, entre outras coisas, detalhamento de ativos, resumo de performance, histórico de movimentação e desempenho por mês.
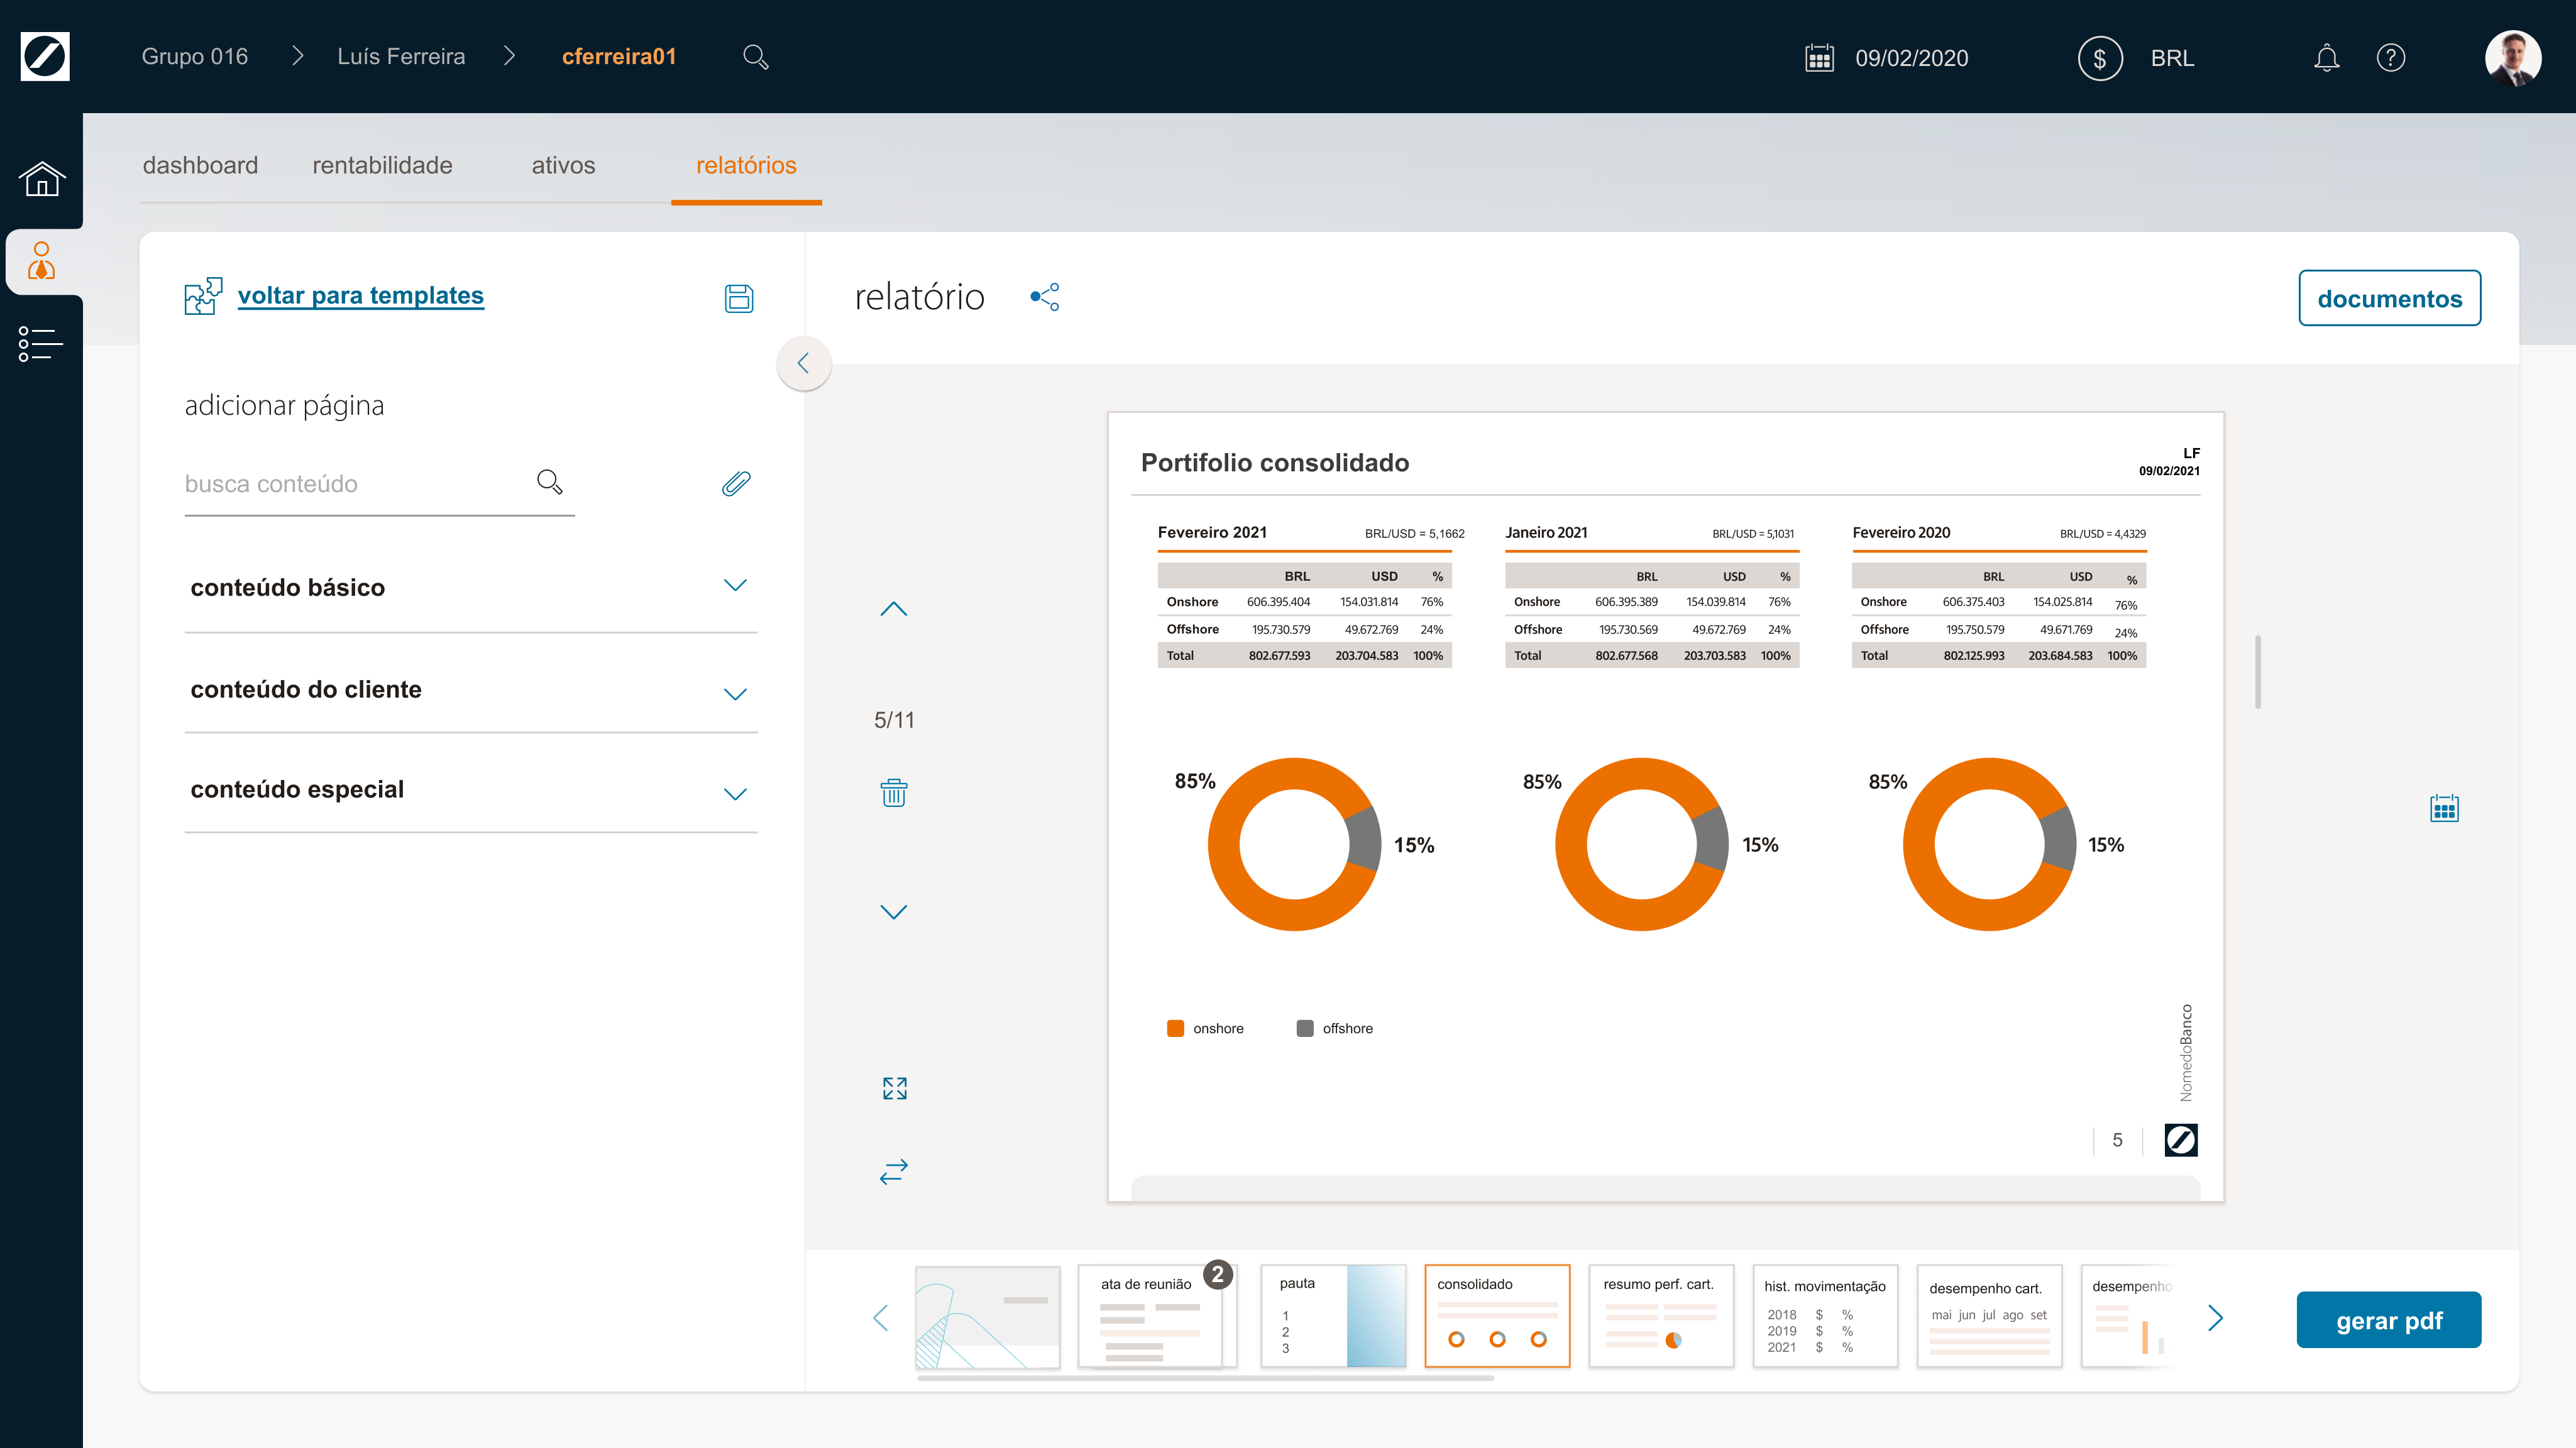
Versão final da página de relatórios (parte 3)
Algumas páginas possuem algumas opções de customização. Além disso, as páginas podem ser reordenadas ou excluídas. O resultado pode ser salvo como um template. Acréscimos pedidos foram novas páginas, meses depois, como a tela de alocação por instituição.
A plataforma, no final, tinha cerca de 250 usuários e, em alguns pontos, servia de referência para outros projetos.
Um desafio foi incluir detalhes e cuidados com acessibilidade, que inicialmente não era prioridade no Private. No começo, o PO estranhou as cores das classes de ativos, escolhidas para minimizar problemas com daltonismo. Após explicações, as cores foram aceitas. Posteriormente, em outros projetos do banco, as cores foram ajustadas para garantir consistência.
Houve inclusão de itens demais em algumas interfaces, a pedido do gerente. Creio que em alguns casos "menos seria mais". Com tantos itens, nem todos foram devidamente testados. Além de maior variedade de perfis de usuários de testes, uma quantidade maior de testes em projetos futuros seria interessante.
Por fim, algo que achei muito interessante no começo foi imprimir os wireframes, permitindo que todos reunidos riscassem e assim expressassem melhor suas opiniões e visões.
I worked for one of the largest banks in Brazil for years, as a consultant at BRQ. Started in January/20, with the very high-income sector (Private) as its client. I was called in as the sole designer to do a project that initially seemed small. It ended up unfolding into 3 large parts/fronts that lasted more than a year.
The pain points in the three parts of the project:
To ensure that this case study takes less than 7 minutes to read, I will be brief, especially in parts 2 and 3.

Example of a sketch/wireframe from the first days for the dashboards, which were taken in print to the meeting.
The first part (task control, minutes and dashboards) began with a week that alternated between one or two hours of conversations with a manager and a specialist and the rest of the time generating wireframes (using Figma). At each meeting, an evolution in the wireframes was presented and what was created was discussed.
At the beginning of the second week we had a low-fidelity prototype that underwent a quick usability test of the dashboards with interviews. Among the tasks we had to look for a client and take the variable income out of the profitability calculations. The interview verified the general perception of the dashboard cards and their information. Among the improvements were the inclusion of a card with assets expirations and better differentiating asset class indicators.

Color study (in high fidelity) for home, after 2 weeks.
The first month more or less continued with this dynamic, developing and adjusting the layout, focusing on the dashboards. The second month focused on activity flows and minutes, in addition to creating the login screen.

Proposal for login screen
The second part followed a more or less similar format, but was even more complex due to the amount of customizations and options. Part 3 started with a small outline that expanded greatly in functions, becoming an online report editor.
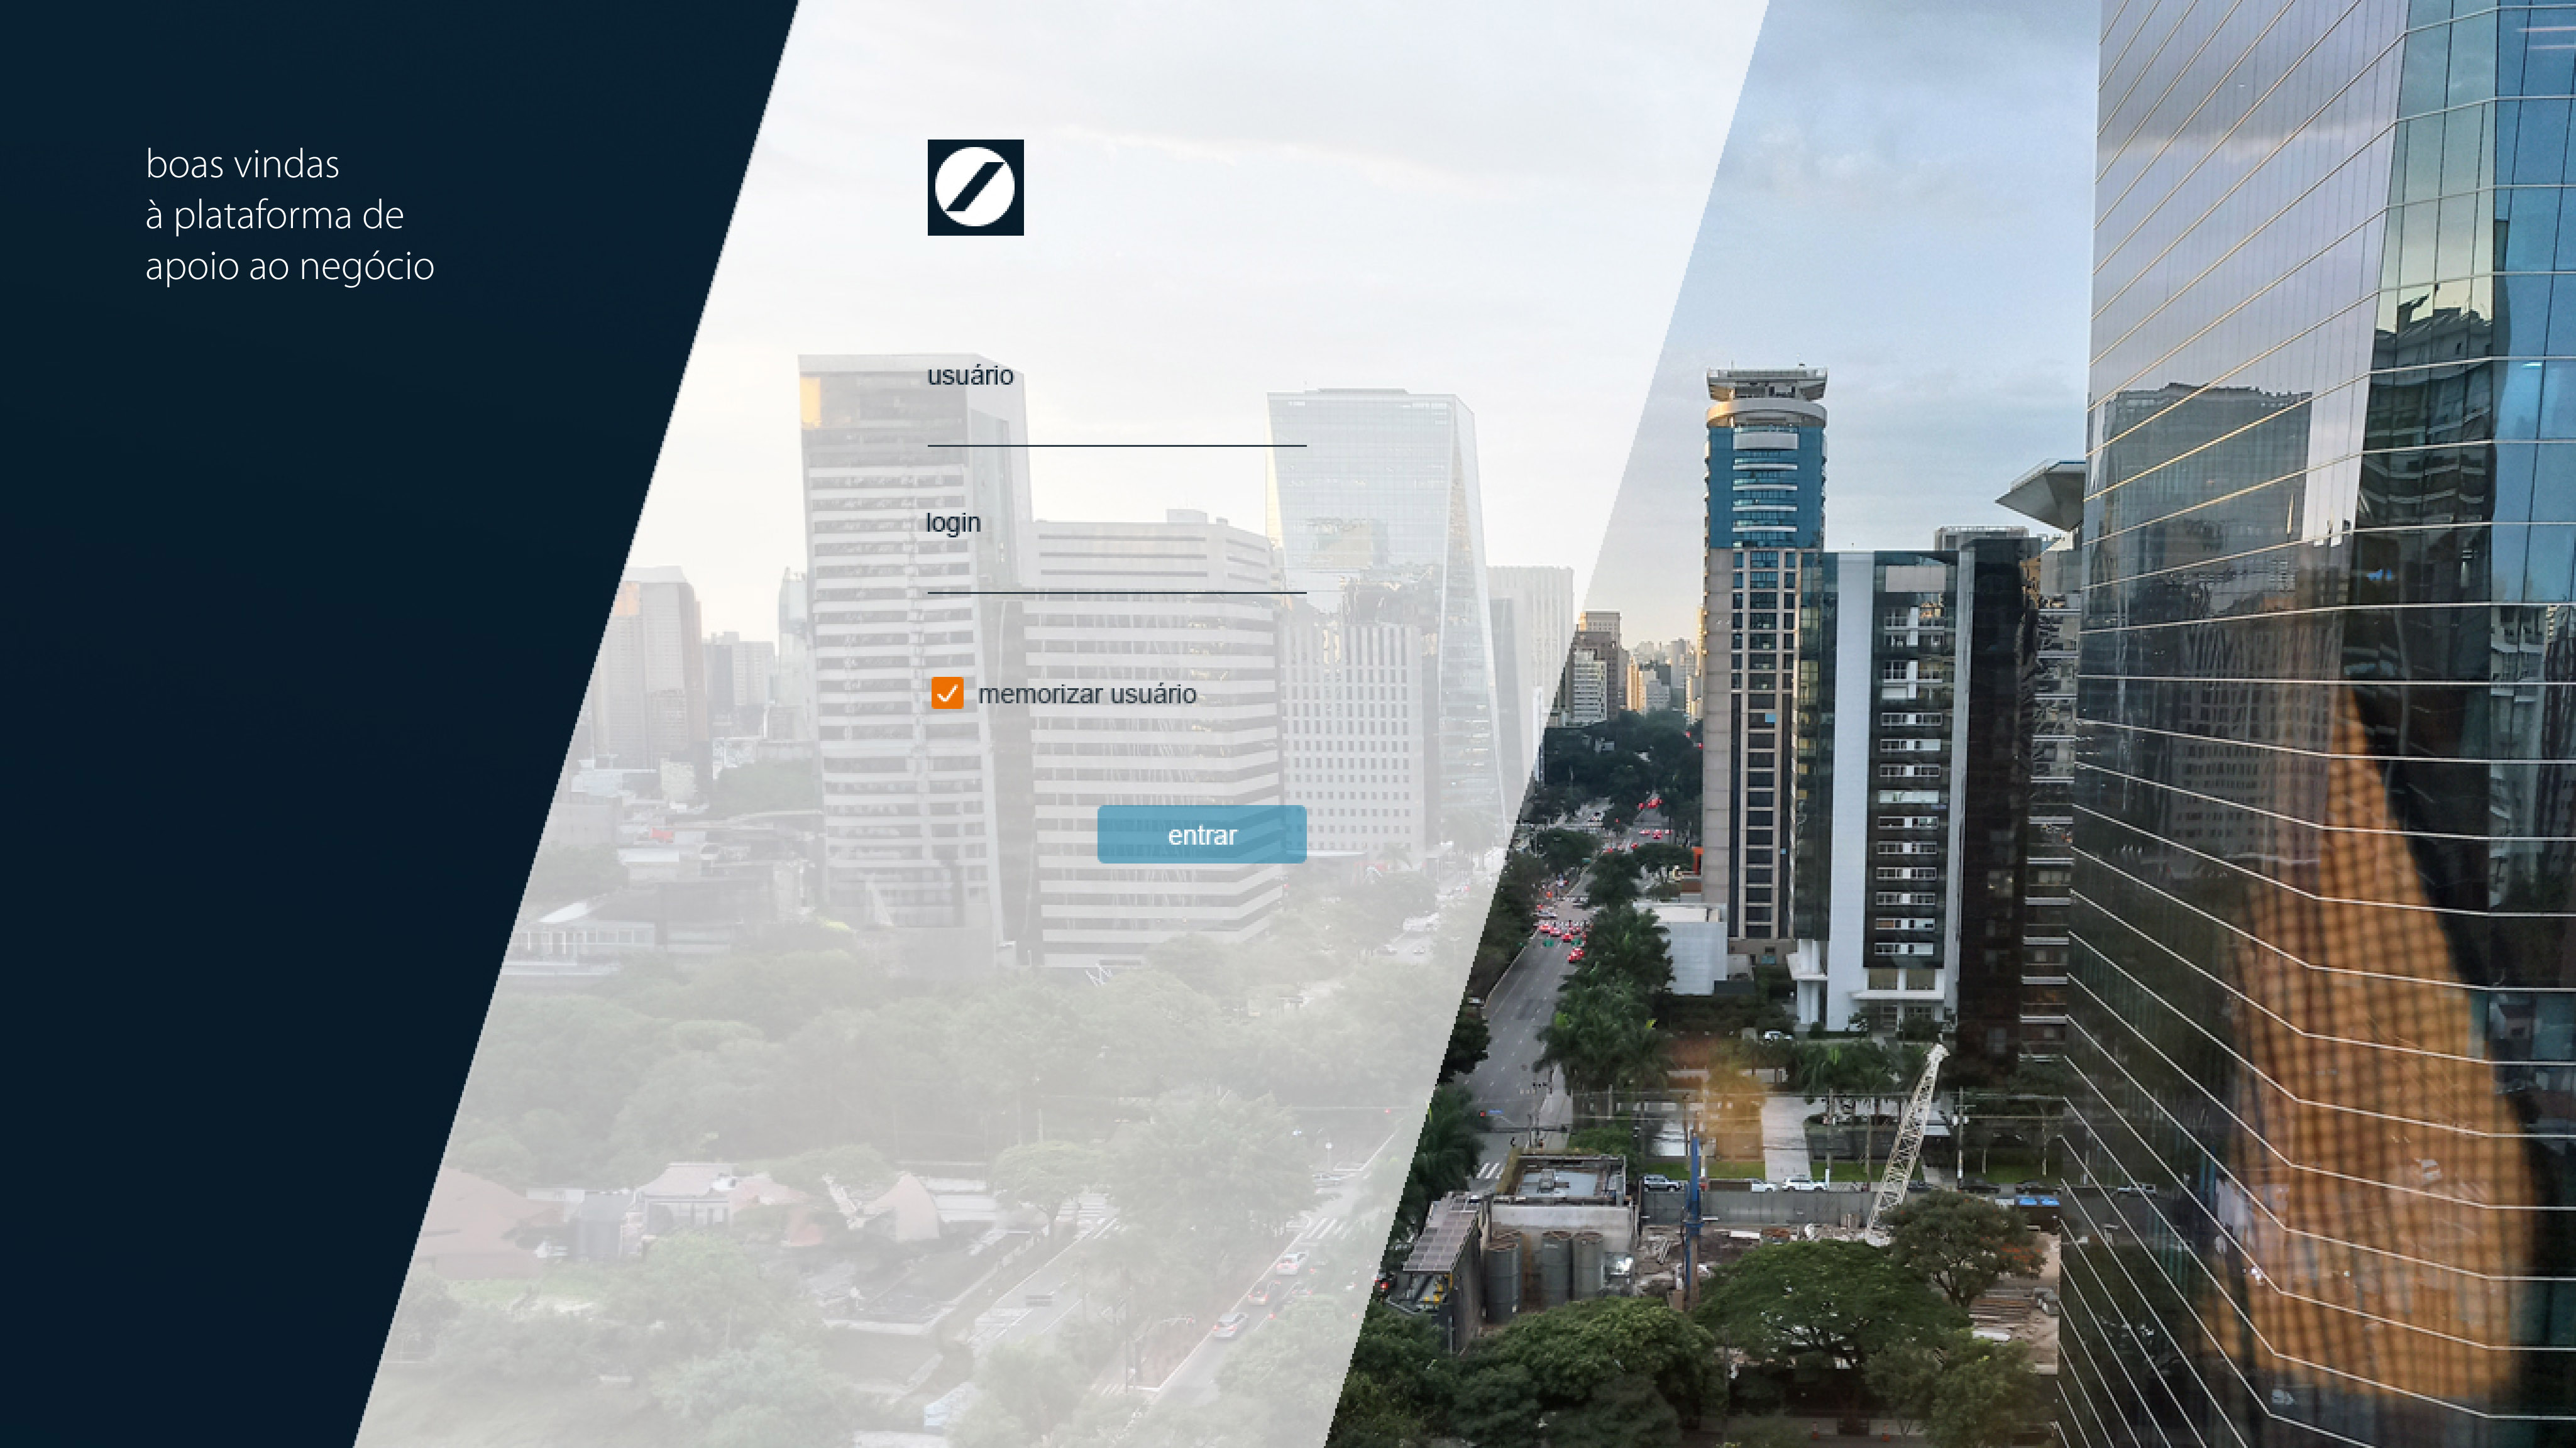
Login screen (final version)

Home (final version)
A mobile version was not made mainly because the investment specialists usually held meetings with their clients using a computer or iPad.

Final version of a Portfólio's general dashboard
Along with the dashboards, the home was developed. However, at the beginning only the list of customers was made. On the dashboard, the initial idea of allowing cards to be moved around (drag and drop) was not implemented as it was not a priority.
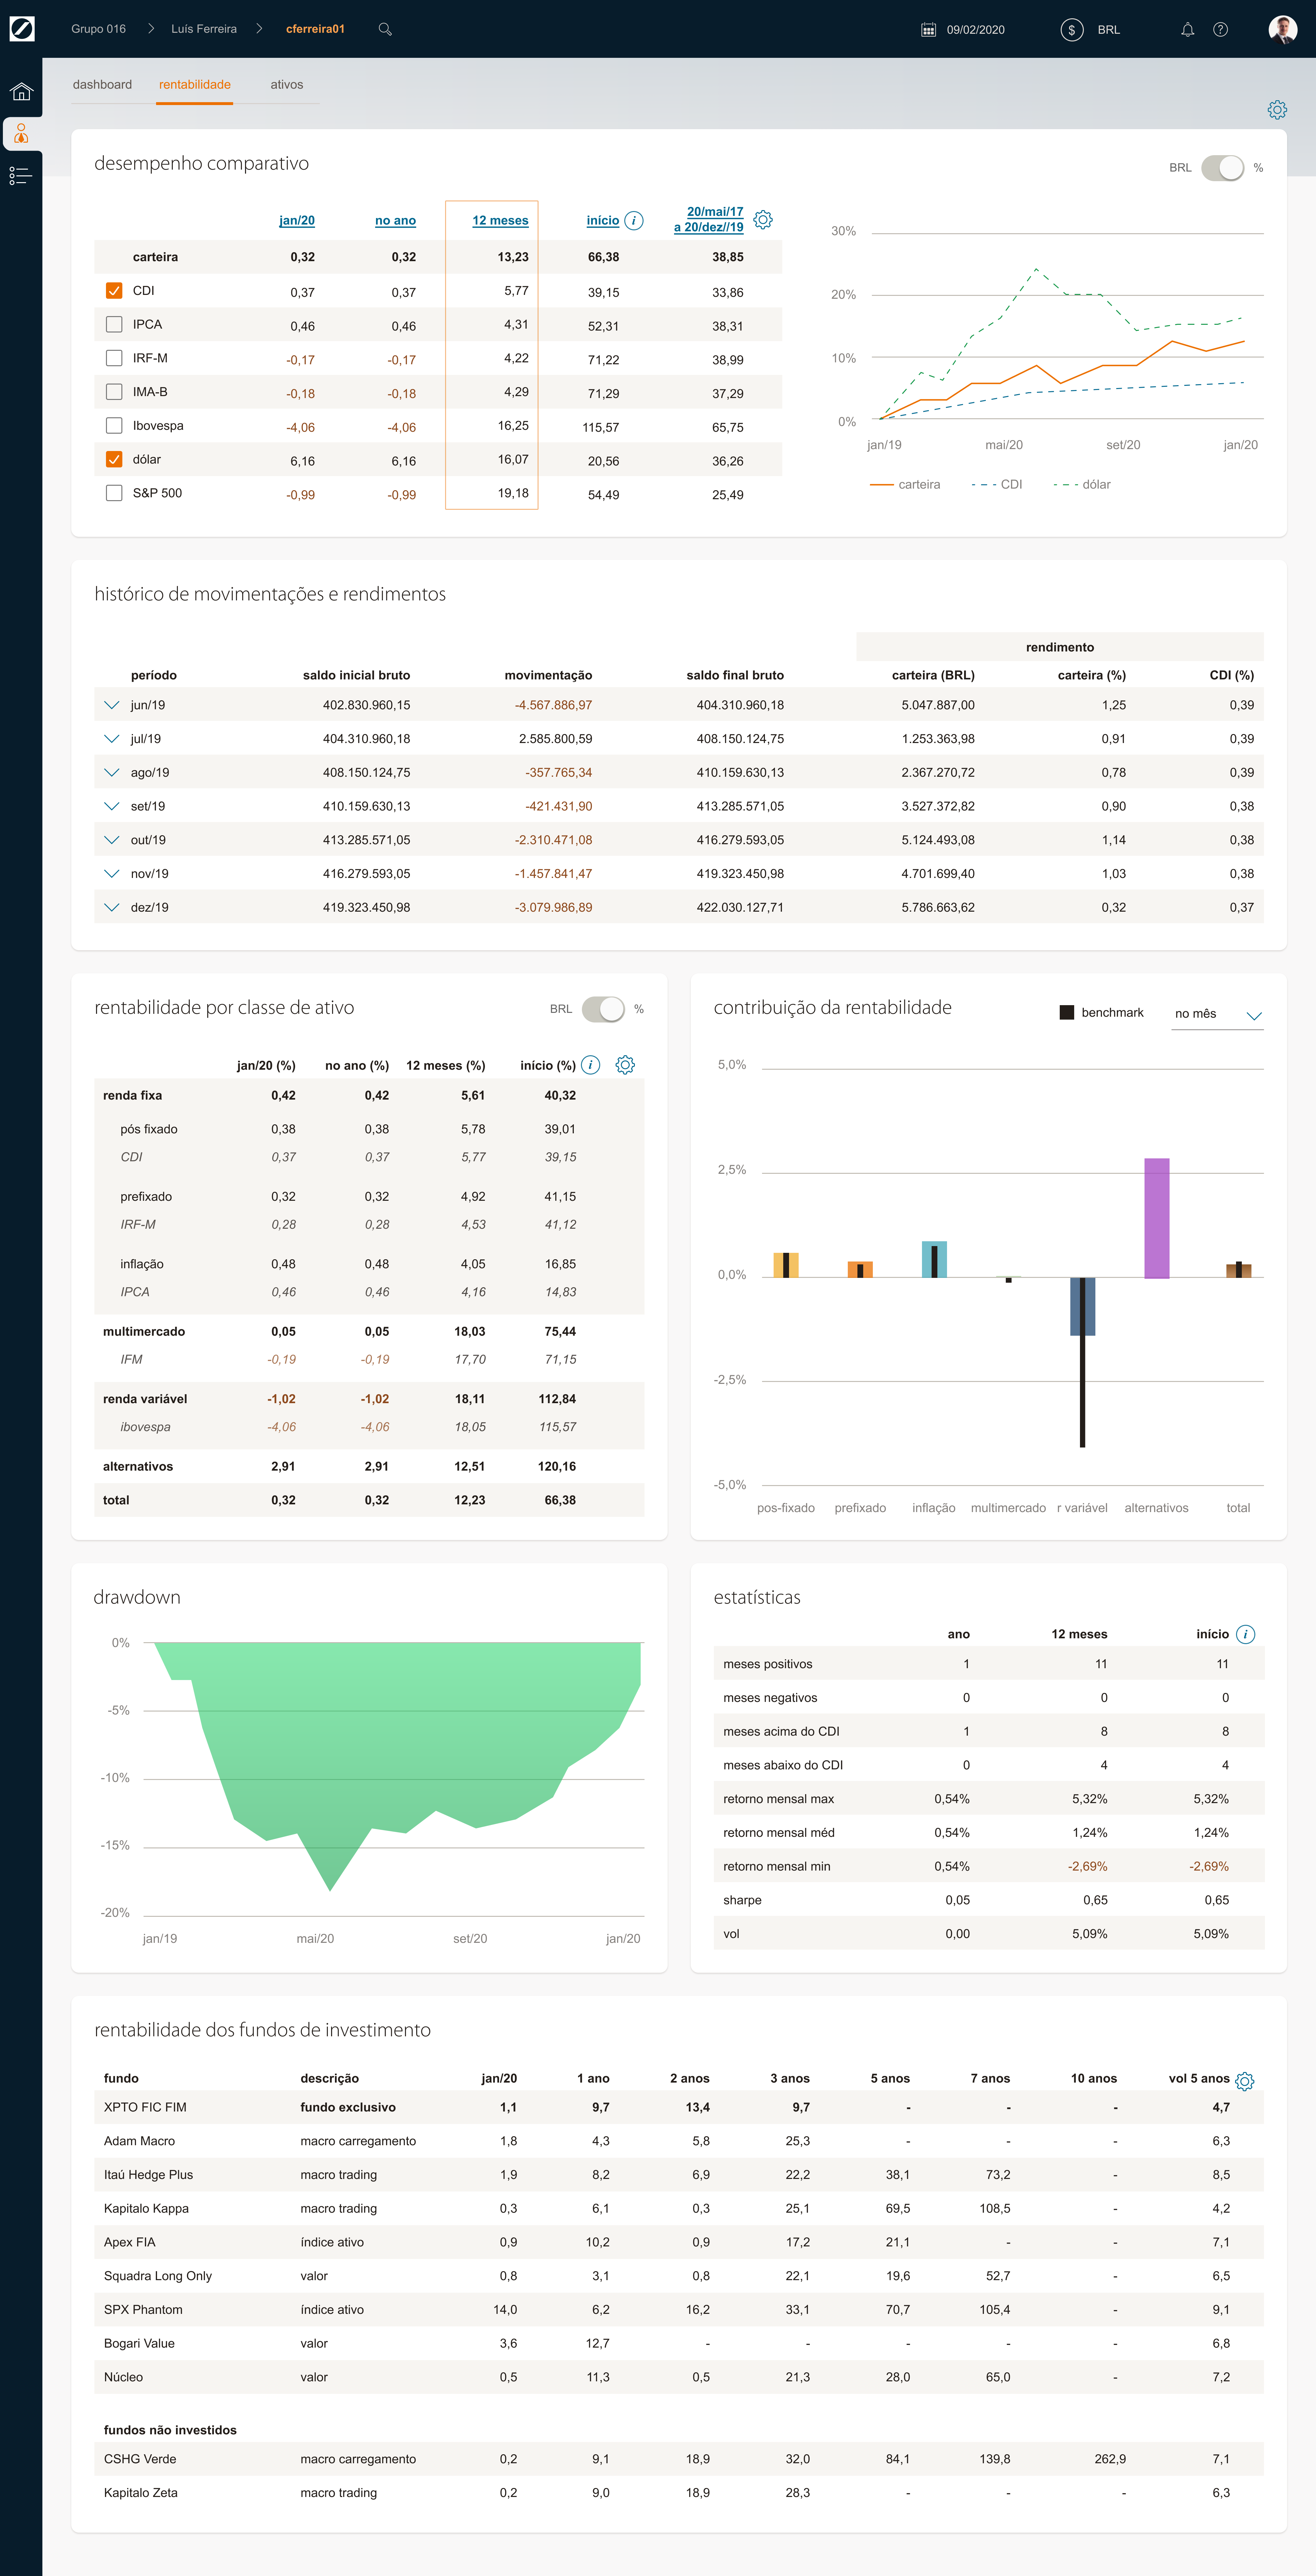
Final version of the profitability dashboard
The menus are divided into three parts: side menu, breadcrumb and tabs. The breadcrumb acts as a search/treeview. The breadcrumb/treeview and search update information on the same screen, without changing pages, using "skeleton" animations to load new data.

Spacing and alignment details
In the top bar, the calendar opened a date picker that would allow you to see the client's Portfólio at another point in the past. The initial focus on development was to do the minimum of the home and the two dashboards, and then do the activities and minutes part. The layout generally followed cards with a distance of 24px between them. Internal spacing (padding) also 24px. The horizontal distance from the card edges is 30px.

Final version of the activity screen
The first screen to be completely developed was the activities screen, followed by the minutes screen. The activities screen organizes tasks for the client, which can appear in meeting minutes and have four statuses (in progress, overdue, done, deleted), each with an icon. Activities can be delegated, contain detailed descriptions, attachments, and team comments. The screen has become more complex due to stakeholder demands.

Final version of the minutes screen, in step 1
The minutes flow has the simplest screens in the entire project. There are 3 steps. In step 2, new activities can be created (at the time of the meeting) or can be included among those that already exist. Part of the work was creating the layout of the minutes, which had to look good both on screen and printed.
Part 2 of the project, assets, contains the most complex screen to understand and develop because it has a large number of possible customizations, filters and options. Columns can be reordered or changed. Funds can be exploded (divided into the assets in which they invest).

Assets screen (part 2)
The table resulting from all filters and customizations can be downloaded in xls or pdf format. It would be possible to create some types of fields to help with classifications and filters.
Part 3 is a presentation/document editor that is taken to the meeting. It includes, among other things, asset details, performance summary, movement history and monthly performance.

Final version of the reporting page (part 3)
Some pages have some customization options. Additionally, pages can be reordered or deleted. The result can be saved as a template. Additions were requested, months later, such as the allocation screen by institution.
Accessibility was a challenge, as it was not initially a priority in Private. The colors of the asset classes were chosen to minimize problems with color blindness, which initially caused surprise in the PO, but after explanations, they were accepted. Later, the colors were adjusted in other projects of the bank to maintain consistency.
Too many items were included in some interfaces, at the manager's request. I believe that in some cases "less would be more". With so many items, not all of them have been properly tested. In addition to a greater variety of test user profiles, a greater number of tests in future projects would be interesting.
Finally, something that I found very interesting at the beginning was printing the wireframes, allowing everyone together to draw and thus better express their opinions and visions.